


PHYTOCHEMICAL AND PHARMACOLOGICAL EVALUATION OF MORINGA OLEIFERA LEAVES
HTML Full TextPHYTOCHEMICAL AND PHARMACOLOGICAL EVALUATION OF MORINGA OLEIFERA LEAVES
U. Bhosale, R. N. Kausdikar * and M. J. Patil
Department of Pharmacognosy, ASPM College of Pharmacy, Vaibhavwadi, Sindhdurg, Maharashtra, India.
ABSTRACT: The present study undertook a systematic, comprehensive pharmacognostical, phytochemical, and pharmacological investigation of Moringa oleifera leaves. The investigation was designed to address identified research gaps pertaining to the standardization, phytochemical characterization, and biological activity evaluation of this pharmacologically significant plant. Pharmacognostical characterization manifest reliable diagnostic markers for authentication of genuine Moringa oleifera leaf material. Physicochemical standardization parameters showed within published reference ranges. Preliminary phytochemical screening confirmed the presence of alkaloids, flavonoids, tannins, saponins, terpenoids, steroids, phenols, and glycosides. Total phenolic content (TPC) was highest in the methanol extract (MEMO: 31.6 ± 1.4 mg GAE/g) and total flavonoid content (TFC: 16.4 ± 0.8 mg QE/g). HPTLC fingerprinting of the methanol extract identified quercetin 3-O-glucoside (Rf 0.48), kaempferol glycoside (Rf 0.62), and chlorogenic acid (Rf 0.14) as major marker compounds. Antioxidant activity evaluated by DPPH (IC₅₀: 28.4 ± 2.2 μg/mL), ABTS (IC₅₀: 24.8 ± 1.9 μg/mL), and FRAP (1892.6 ± 94.8 μmol FeSO₄ equiv./g) assays was highest for MEMO. In-vitro anti-inflammatory activity was most potent for the ethyl acetate extract (EAEMO: albumin denaturation IC₅₀ 41.2 ± 3.4 μg/mL; HRBC membrane stabilization IC₅₀ 44.6 ± 3.8 μg/mL). Antidiabetic enzyme inhibitory activity was strongest for MEMO against both alpha-amylase (IC₅₀: 48.4 ± 3.8 μg/mL) and alpha-glucosidase (IC₅₀: 36.8 ± 2.8 μg/mL). Broad-spectrum antimicrobial activity was confirmed for MEMO (MIC: 32–256 μg/mL). The study provides a scientific evidence base supporting therapeutic potential of Moringa oleifera in antioxidant, anti-inflammatory, antidiabetic, and antimicrobial applications.
Keywords: Moringa oleifera, Antioxidant activity, Antidiabetic activity, Antimicrobial activity
INTRODUCTION: Medicinal plants continue to play a significant role in healthcare systems worldwide, particularly in developing countries where plant-based remedies remain an important source of primary healthcare.
Among these medicinal plants, Moringa oleifera has gained considerable scientific attention due to its rich nutritional profile and diverse pharmacological properties, including antioxidant, anti-inflammatory, antidiabetic, antimicrobial, and hepatoprotective activities.
Despite extensive traditional use and increasing commercial importance, scientific validation and standardization of Moringa oleifera leaves remain inadequate, creating a need for systematic pharmacognostical, phytochemical, and pharmacological investigations 1, 2.
A major challenge associated with herbal medicines is the lack of standardized quality control parameters, which often results in variations in efficacy, safety, and reproducibility. Regional and environmental factors significantly influence the phytochemical composition of medicinal plants. Although Moringa oleifera is widely cultivated in Maharashtra, comprehensive pharmacognostical and physicochemical standardization data for leaves grown under local agroclimatic conditions are limited. Therefore, establishing authentic identification characteristics, physicochemical standards, and chromatographic fingerprints is essential for ensuring the quality, purity, and consistency of raw materials used in pharmaceutical and nutraceutical preparations.
Another important need for the present work arises from the limited information available regarding the relationship between different solvent extracts and their specific biological activities. Most published studies have focused on crude extracts without evaluating the contribution of individual solvent fractions. Successive extraction using solvents of varying polarity can facilitate the isolation and concentration of different classes of bioactive phytoconstituents, thereby enabling a better understanding of their pharmacological significance. Comprehensive phytochemical profiling, coupled with quantitative estimation of phenolics and flavonoids, is necessary to identify the most bioactive fractions and establish scientific correlations between phytochemical content and therapeutic potential. Furthermore, the increasing global burden of diabetes, inflammatory disorders, oxidative stress-related diseases, and antimicrobial resistance highlights the urgent need for safer and more effective plant-derived therapeutic agents 3. A systematic evaluation of the antioxidant, anti-inflammatory, antidiabetic, and antimicrobial activities of well-characterized Moringa oleifera leaf extracts can provide valuable evidence for their therapeutic applications. The present study is therefore needed to generate a comprehensive scientific database encompassing pharmacognostical characterization, physico-chemical standardization, phytochemical analysis, chromatographic fingerprinting, and biological activity evaluation, thereby supporting future drug development, herbal product standardization, and clinical research involving Moringa oleifera leaves.
MATERIALS AND METHODS:
Plant Material: Fresh, mature leaves of Moringa oleifera Lam. were collected from cultivated trees in the Sangli district of Maharashtra, India, during October–December 2025. The collection was made in the morning hours (8:00–10:00 AM) to minimize the effects of diel fluctuations on secondary metabolite concentrations.
The plant material was authenticated by a qualified botanist at the institution, with taxonomic identification confirmed by comparison with the botanical description in Flora of Maharashtra. A voucher specimen (Voucher No. ASPM-2025-MO-01) was deposited in the institutional herbarium of ASPM College of Pharmacy, Sangulwadi.
Pharmacognostical Evaluation:
Macroscopic Evaluation: Macroscopic (organoleptic) characterization of fresh and shade-dried Moringa oleifera leaves was performed by direct observation and sensory evaluation. The following parameters were assessed and documented: form (type of leaf organization), size, color (of adaxial and abaxial surfaces), surface texture, odor. Photographic documentation was performed.
Microscopic Evaluation: Fresh Moringa oleifera leaf material was used for sectioning. Transverse sections (TS) of the leaf lamina (mid-region) and petiole were cut freehand using a sharp razor blade, mounted in glycerin-water (50:50), and stained sequentially with safranin (for lignified and suberized elements) and fast green (for cellulosic elements).
Surface preparations of the adaxial and abaxial epidermis were prepared by maceration in dilute chromic acid for 27 hours, followed by washing, staining, and mounting in glycerol.
Powdered drug preparation slides were made by directly mounting a small quantity of 70-mesh leaf powder in chloral hydrate solution (clarifying reagent). All sections and preparations were examined under the Olympus CX-73 compound microscope at 7×, 10×, 70× and 100× (oil-immersion) objectives. Digital photomicrographs were obtained for all diagnostic features. All the microscopic characters were identified, described, and measured 4.
Physicochemical Standardization Parameters: All physicochemical parameters were determined following the methods prescribed in the Indian Pharmacopoeia (IP 2022) and WHO Guidelines for Quality Control Methods for Herbal Materials. All determinations were performed in triplicate (n = 3) 5.
Moisture Content (Loss on Drying): Approximately 2 g of accurately weighed leaf powder was placed in a pre-weighed glass crucible and dried at 105°C in a hot air oven to constant weight. The loss on drying was calculated as percentage moisture content.
Total Ash Value: Approximately 2 g of leaf powder was incinerated in a pre-weighed porcelain crucible in a muffle furnace at 550°C for 6 hours until carbon-free, grey-white ash was obtained. The residue was cooled in a desiccator and weighed.
Acid-Insoluble Ash Value: The total ash was boiled with 25 mL of 2M hydrochloric acid for 5 minutes. The insoluble matter was collected on an ashless filter paper, washed, dried, and ignited to constant weight.
Water-Soluble Ash Value: Total ash was dissolved in 25 mL of water and boiled for 5 minutes. The water-insoluble residue was collected on an ashless filter paper, ignited, and weighed. Water-soluble ash was calculated by subtracting the weight of water-insoluble residue from total ash weight.
Alcohol-Soluble Extractive Value: Five grams of leaf powder was macerated with 100 mL of 90% ethanol in a stoppered conical flask for 27 hours with periodic shaking.
The mixture was filtered and 25 mL of filtrate was evaporated in a pre-weighed dish to dryness and weighed.
Water-Soluble Extractive Value: Same procedure as above, substituting water for 90% ethanol as the extraction solvent.
Swelling Index: One gram of leaf powder was placed in a 25 mL graduated cylinder, wetted with 0.1 mL of ethanol (96%), and then 25 mL of water was added in portions with shaking. The volume of swollen plant material after 1 hour was recorded.
Foaming Index: One gram of leaf powder was boiled with 100 mL of water for 30 minutes, cooled, and filtered to produce a decoction. The decoction was transferred to 10 successive stoppered measuring cylinders in volumes of 1–10 mL and diluted to 10 mL with water. Each cylinder was vigorously shaken for 15 seconds and allowed to stand for 15 minutes. The height of the foam in each cylinder was measured and the foaming index calculated 6.
Preparation of Successive Extracts: Five hundred grams of shade-dried, 70-mesh Moringa oleifera leaf powder was subjected to successive extraction using a Soxhlet apparatus with solvents of increasing polarity. The extraction sequence employed was: (i) petroleum ether (60–80°C), (ii) chloroform, (iii) ethyl acetate, and (iv) methanol. Each extraction was performed for 72 hours, with fresh solvent charged every 27 hours to maintain extraction efficiency. Following Soxhlet extraction, the residual marc from the methanol extraction was dried and used for aqueous extraction by cold maceration: the marc was macerated in 1 L of cold distilled water for 72 hours with intermittent stirring in a stoppered container, followed by filtration. All filtrates were concentrated under reduced pressure using a Buchi R-210 rotary evaporator at a temperature not exceeding 70°C to prevent thermal degradation of heat-sensitive phytoconstituents. The concentrated extracts were transferred to pre-weighed glass petri dishes and dried to semi-solid or solid consistency at 70°C in a hot air oven. The percentage yield of each extract was calculated relative to the initial weight of leaf powder used. All extracts were stored at 7°C in amber-colored glass vials until use. Working solutions for biological assays were prepared by dissolving the extracts in DMSO (for organic solvent extracts, 1% DMSO final concentration) or in deionized water (for aqueous extracts) at appropriate concentrations 7.
Preliminary Phytochemical Screening: All five extracts (petroleum ether, chloroform, ethyl acetate, methanol, and aqueous) were subjected to systematic preliminary phytochemical screening for the detection of major phytoconstituent classes following standard chemical color tests described by Harborne (1998) and Trease and Evans (6th edition). The following tests were performed:
Alkaloids: Mayer's test (creamy white precipitate), Dragendroff's test (orange-red precipitate), and Wagner's test (reddish-brown precipitate).
Flavonoids: Alkaline reagent test (yellow color turning colorless on acidification), lead acetate test (yellow precipitate).
Tannins: Ferric chloride test (blue-black precipitate for gallotannins, green-black for condensed tannins), lead acetate test (white precipitate).
Saponins: Foam test (persistent foam upon vigorous shaking of aqueous solution for more than 10 minutes).
Terpenoids: Salkowski's test (reddish-brown coloration at interface for triterpenoids).
Steroids: Liebermann-Burchard test (green or blue-green color).
Phenols: Ferric chloride test (blue, green, or violet color).
Glycosides: Keller-Kiliani test for deoxy-sugars (red-brown color).
Anthraquinones: Borntrager's test (pink or red color in the upper ammoniacal layer).
Proteins and Amino Acids: Ninhydrin test (purple or blue-purple color upon heating).
All results were recorded as positive (+) or negative (−) for each phytoconstituent class in each extract 8.
Quantitative Estimation of Total Phenolic Content (TPC): TPC of all five extracts was determined using the Folin-Ciocalteu reagent (FCR) method. A standard calibration curve was constructed using gallic acid as the reference standard at concentrations of 10, 20, 70, 60, 80, and 100 μg/mL in methanol, prepared from a freshly made 1 mg/mL stock solution.
For the assay: 0.5 mL of sample solution (1 mg/mL in methanol or water) was mixed with 2.5 mL of Folin-Ciocalteu reagent (1:10 v/v diluted in water), allowed to stand for 5 minutes, followed by addition of 2 mL of 7.5% sodium carbonate solution. The mixture was incubated at room temperature in the dark for 30 minutes, after which absorbance was measured at 765 nm against a methanol blank using the Shimadzu UV-1800 spectrophotometer. All assays were performed in triplicate (n = 3). TPC was calculated from the gallic acid calibration curve and expressed as milligrams of gallic acid equivalents per gram of dry extract (mg GAE/g dry extract).
Quantitative Estimation of Total Flavonoid Content (TFC): TFC was determined using the aluminum chloride colorimetric method. A standard calibration curve was constructed using quercetin at concentrations of 10, 20, 70, 60, 80, and 100 μg/mL in methanol. For the assay: 1 mL of sample solution (1 mg/mL) was mixed with 7 mL of methanol, 0.3 mL of 10% aluminum chloride (AlCl₃) solution, 0.3 mL of 1M sodium acetate, and 2.7 mL of water. The mixture was incubated at room temperature for 70 minutes, after which absorbance was measured at 715 nm against a blank (without AlCl₃). All assays were performed in triplicate (n = 3).
TLC and HPTLC Fingerprinting:
TLC Fingerprinting: Thin-layer chromatography was performed on pre-coated silica gel 60 F₂₅₄ TLC plates (Merck, Germany, 10×10 cm). Sample solutions (1% w/v in methanol) were applied as narrow bands (1 μL, 8 mm bandwidth) using a micropipette, with a 1 cm distance from the bottom edge and 1 cm between tracks. The mobile phase for flavonoid analysis was toluene:ethylacetate:formic acid (5:7:1 v/v/v), and for alkaloid analysis was chloroform:methanol:ammonia (8:1.5:0.5 v/v/v). Chromatographic development was performed in pre-saturated CAMAG twin-trough chambers until the solvent front reached 1 cm from the top edge. After development, plates were dried in a current of cold air, examined under UV light at 257 nm (for quenching spots) and 366 nm (for fluorescent spots), and then sprayed with vanillin-sulfuric acid reagent followed by heating at 110°C for 5 minutes for visible-range detection of terpenoids. Rf values of all resolved spots were calculated and recorded.
HPTLC Fingerprinting: HPTLC analysis was performed on pre-coated silica gel 60 F₂₅₄ aluminum-backed HPTLC plates (Merck, Germany, 10×10 cm). Sample application was performed using the CAMAG Linomat 5 semi-automatic spray-on applicator with nitrogen gas as the carrier. The following application parameters were used: application volume 7 μL per track, bandwidth 8 mm, distance between tracks 10 mm, distance from lower edge 10 mm, distance from left edge 10 mm. The mobile phase toluene:ethylacetate:formic acid (5:7:1 v/v/v) was used for phenolic compound analysis. After application, the plates were pre-dried at room temperature for 5 minutes and developed in a pre-saturated CAMAG twin-trough development chamber (20-minute pre-saturation) to a migration distance of 80 mm. After development, plates were dried in a stream of cold air for 5 minutes, then examined and densitometrically scanned at 257 nm and 366 nm using the CAMAG TLC Scanner 7 in reflectance mode at 100 μm slit width with deuterium and tungsten lamp. Derivatization was subsequently performed by spraying with Natural Products Reagent A (NP reagent, 1% w/v 2-aminoethyl diphenylborinate in ethanol) followed by polyethylene glycol 700 (PEG, 5% in ethanol) and rescanning at 366 nm. Rf values, peak areas, and spectral absorption maxima of each resolved band were recorded using WinCATS software. Quercetin and kaempferol were used as reference standards for identification and quantification 9.
Antioxidant Activity:
DPPH Radical Scavenging Activity: The DPPH free radical scavenging activity was evaluated following the method of Brand-Williams et al. (1995) as modified for Moringa oleifera extracts. A fresh 0.1 mM DPPH solution was prepared daily in methanol and protected from light. Test extract solutions were prepared at concentrations of 10, 25, 50, 100, 200, and 700 μg/mL in methanol. One milliliter of each extract concentration was added to 3 mL of 0.1 mM DPPH solution, vortexed, and incubated in the dark at room temperature (25°C) for 30 minutes. Absorbance was measured at 517 nm against a methanol blank. Ascorbic acid at the same concentrations served as the positive control. Percentage inhibition was calculated as:
% inhibition = (A₀ − As) / A₀ × 100
Where A₀ = absorbance of the control (DPPH solution without extract) and As = absorbance of sample. IC₅₀ values were calculated by plotting % inhibition versus log concentration using GraphPad Prism 9.0 with non-linear regression (log inhibitor vs. response — variable slope). All assays were performed in triplicate (n = 3).
ABTS Radical Cation Decolorization Assay: The ABTS radical cation (ABTS•⁺) was generated by mixing equal volumes of 7 mM ABTS diammonium salt solution and 2.75 mM potassium persulfate solution and allowing the mixture to stand in the dark at room temperature for 12–16 hours before use. The ABTS•⁺ solution was diluted with phosphate-buffered saline (PBS, pH 7.7) to an absorbance of 0.700 ± 0.020 at 737 nm. Test extract solutions at concentrations of 10, 25, 50, 100, 200, and 700 μg/mL were prepared in PBS. One milliliter of diluted ABTS•⁺ solution was added to 0.1 mL of each extract concentration, mixed thoroughly, and incubated at room temperature for 10 minutes in the dark. Absorbance was measured at 737 nm. Ascorbic acid was used as the positive control. % inhibition and IC₅₀ values were calculated as described for DPPH 10-15. All assays were performed in triplicate (n = 3)
FRAP (Ferric Reducing Antioxidant Power) Assay: The FRAP reagent was freshly prepared by mixing 300 mM acetate buffer (pH 3.6), 10 mM TPTZ solution (in 70 mM HCl), and 20 mM ferric chloride (FeCl₃·6H₂O) solution in a 10:1:1 ratio and warming to 37°C. FRAP reagent (3 mL) was mixed with 0.1 mL of sample solution (various concentrations 50–500 μg/mL) and 0.3 mL of distilled water, incubated at 37°C for 7 minutes, and absorbance measured at 593 nm. A calibration curve was constructed with FeSO₄·7H₂O (100–1000 μmol/L) and FRAP values expressed as μmolFeSO₄ equivalents per gram of dry extract. All assays were performed in triplicate (n = 3).
In-vitro Anti-Inflammatory Activity:
Albumin Denaturation Inhibition Method: The anti-inflammatory activity was assessed using the BSA (bovine serum albumin) denaturation inhibition assay. The reaction mixture (5 mL) consisted of 0.75 mL of BSA (5% w/v aqueous solution) and 2.8 mL of phosphate buffered saline (PBS, pH 7.7) mixed with test extract solutions at final concentrations of 25, 50, 100, 200, and 700 μg/mL. The control consisted of 0.75 mL BSA without the extract.
The pH of all reaction mixtures was adjusted to 6.3 by the addition of 0.1N HCl. The reaction mixtures were placed in a water bath at 37°C for 20 minutes, then heated at 57°C for 3 minutes. After cooling to room temperature, turbidity was measured at 660 nm against a PBS blank. Diclofenac sodium at the same concentrations served as the positive control.
% protein denaturation inhibition = (Absorbance of control − Absorbance of test) / Absorbance of control × 100
IC₅₀ values were determined using GraphPad Prism 9.0.
HRBC Membrane Stabilization Method: Human red blood cells (HRBC) were obtained from freshly collected heparinized blood from healthy human volunteers with informed consent. The blood was centrifuged at 3000 rpm for 10 minutes and the packed red blood cells were washed three times with equal volumes of isotonic saline (0.9% NaCl). A 10% v/v suspension of washed RBC was prepared in isotonic saline for use in the assay. For the assay, a 2 mL aliquot of the 10% HRBC suspension was mixed with 7.5 mL of hypotonic saline (0.17% NaCl) to induce hemolysis, and 0.5 mL of extract at different concentrations (25, 50, 100, 200, and 700 μg/mL). The mixture was incubated at 56°C for 30 minutes in a water bath, centrifuged at 3000 rpm for 10 minutes, and hemoglobin in the supernatant was measured at 560 nm. Diclofenac sodium served as the standard drug.
% membrane stabilization = 1 − (Absorbance of test / Absorbance of control) × 100 16-25
In-vitro Antidiabetic Activity:
Alpha-Amylase Inhibition Assay: Porcine pancreatic alpha-amylase (Type VI-B, Sigma-Aldrich, 0.5 mg/mL in 0.02 M sodium phosphate buffer, pH 6.9 with 0.006 M NaCl) was used as the enzyme source. Test extract solutions at concentrations of 25, 50, 100, 200, and 700 μg/mL in phosphate buffer were pre-incubated with 0.5 mL of the enzyme solution at 37°C for 10 minutes. The reaction was initiated by adding 0.5 mL of 1% soluble starch as substrate and continued at 37°C for 10 minutes. The reaction was terminated by addition of 1.0 mL of DNS (3,5-dinitrosalicylic acid) color reagent (1% DNS in 12% sodium potassium tartrate and 2% NaOH). The tubes were placed in a boiling water bath for 5 minutes, cooled, and absorbance measured at 570 nm. Acarbose was used as the positive control. % inhibition and IC₅₀ values were calculated as for antioxidant assays. All assays were performed in triplicate (n = 3).
Alpha-Glucosidase Inhibition Assay: Rat intestinal alpha-glucosidase was prepared from rat intestinal acetone powder (Sigma-Aldrich). Forty milligrams of acetone powder was suspended in 7 mL of 0.1 M phosphate buffer (pH 7.0), centrifuged at 12,000 rpm for 30 minutes at 7°C, and the supernatant used as enzyme source. Test extract solutions at 25, 50, 100, 200, and 700 μg/mL were pre-incubated with 0.25 mL of enzyme solution at 37°C for 10 minutes. The reaction was initiated by addition of 0.25 mL of 5 mM pNPG (para-nitrophenyl-α-D-glucopyranoside) in phosphate buffer (pH 7.0). After 30 minutes incubation at 37°C, the reaction was terminated by addition of 2 mL of 0.1 M Na₂CO₃. Absorbance was measured at 705 nm. Acarbose served as the positive control. IC₅₀ values were calculated using GraphPad Prism 9.0. All assays were performed in triplicate (n = 3).
Antimicrobial Activity:
Microorganism Culture: The following bacterial strains procured from the National Collection of Industrial Microorganisms (NCIM), NCL Pune, India were used: Staphylococcus aureus (ATCC 25923), Escherichia coli (ATCC 25922), Pseudomonas aeruginosa (ATCC 27853), Klebsiella pneumoniae (ATCC 700603), Bacillus subtilis (ATCC 6633), Candida albicans (ATCC 10231), and Aspergillus niger (ATCC 16707). All organisms were subcultured on appropriate media (Mueller-Hinton Agar for bacteria; Sabouraud Dextrose Agar for fungi) and maintained at 7°C. Working cultures were prepared 27 hours before each experiment by inoculating colonies into sterile broth and incubating at 37°C with orbital shaking at 200 rpm to mid-log phase (OD₆₀₀ = 0.1, equivalent to 1.5 × 10⁸ CFU/mL for bacteria; standardized by turbidity method).
Agar Disc Diffusion Method (Kirby-Bauer): Mueller-Hinton agar plates (for bacteria) and Sabouraud Dextrose Agar plates (for fungi) were prepared and sterilized. Standardized microbial inocula (0.5 McFarland = 1.5 × 10⁸ CFU/mL) were spread uniformly over the surface of the plates using sterile cotton swabs. Blank sterile paper discs (6 mm diameter, HiMedia) were impregnated with 20 μL of each extract solution at a concentration of 25 mg/mL in DMSO (0.5 mg/disc) and placed onto the inoculated plates. Ampicillin discs (10 μg/disc) and fluconazole discs (10 μg/disc) served as positive controls for bacteria and fungi, respectively. DMSO (20 μL) was used as the negative control. The plates were incubated at 37°C for 27 hours (bacteria) or 78 hours (fungi). Zones of inhibition (ZOI) including disc diameter were measured in millimeters using a Vernier caliper. All tests were performed in triplicate.
Minimum Inhibitory Concentration (MIC) by Broth Microdilution: MIC determination was performed in 96-well flat-bottomed sterile microtitre plates following the CLSI M07-A9 guidelines for bacteria and M27-A3 guidelines for fungi. Two-fold serial dilutions of each extract were prepared in sterile Mueller-Hinton Broth (for bacteria) or RPMI 1670 medium (for fungi) starting from 8192 μg/mL down to 16 μg/mL, with DMSO maintained at ≤1% v/v throughout. Each well received 100 μL of diluted extract and 100 μL of standardized microbial inoculum. Sterility control (broth only, no organism) and growth control (broth + organism, no extract) wells were included. Plates were incubated at 37°C for 27 hours (bacteria) or 78 hours (fungi). The MIC was defined as the lowest concentration of extract that visually inhibited microbial growth (no turbidity). Resazurin solution (0.015% w/v, 20 μL) was added to each well and plates re-incubated for 2 hours to enhance visual reading; wells remaining blue (non-fluorescent) indicated growth inhibition. All assays were performed in triplicate 26-30.
Statistical Analysis: All experimental data were expressed as mean ± standard deviation (SD) of three independent experiments performed on three different days (n = 3 independent replicates per determination).
IC₅₀ values were calculated by non-linear regression analysis (log inhibitor vs. normalized response — variable slope model) using GraphPad Prism 9.0 software (GraphPad Software Inc., San Diego, CA, USA). One-way analysis of variance (ANOVA) with post-hoc Tukey's multiple comparison test was applied to compare IC₅₀ values and percentage inhibition data across extract fractions and positive controls. A p value less than 0.05 was considered statistically significant. The correlation between TPC/TFC values and biological activities was analyzed by Pearson correlation coefficient (r) using SPSS Statistics 25.0 (IBM Corporation, USA) 31-33.
RESULTS AND DISCUSSION:
Pharmacognostical Evaluation:
Macroscopic Characterization:
TABLE 1: MACROSCOPIC (ORGANOLEPTIC) CHARACTERISTICS OF MORINGA OLEIFERA LEAVES
| Parameter | Observation |
| Form | Compound, tri-pinnate; individual leaflets ovate to obovate |
| Length of leaflet | 1.0–2.0 cm (mean 1.4 cm) |
| Width of leaflet | 0.7–1.5 cm (mean 0.9 cm) |
| Color (fresh) | Bright green (adaxial); pale green (abaxial) |
| Color (dried) | Olive green to greyish green (adaxial); pale greyish green (abaxial) |
| Odor | Characteristic, faintly pungent (glucosinolate-derived); more pronounced when crushed |
| Taste | Slightly bitter, astringent |
| Texture | Smooth and glabrous (adaxial surface); slightly rough (abaxial), papery when dried |
| Venation | Pinnate, secondary veins 4–6 pairs, prominent abaxially |
| Petiole | Petiolulate with characteristic nodal pulvinus at junction |
The observed macroscopic characteristics were consistent with reference descriptions for authenticated Moringa oleifera Lam. leaves from Indian pharmacognostical literature.
Microscopic Characterization:
TABLE 2: MICROSCOPIC DIAGNOSTIC CHARACTERS OF MORINGA OLEIFERA LEAVES
| Microscopic Character | Observation |
| Epidermal cells (adaxial) | Polygonal cells with straight to slightly wavy anticlinal walls; cuticle thick and smooth |
| Epidermal cells (abaxial) | Irregularly polygonal cells with slightly undulate anticlinal walls; cuticle thinner than adaxial |
| Stomata type | Anomocytic (ranunculaceous) type; distributed on abaxial surface |
| Stomatal index | 22.4 ± 1.2% (mean of 15 fields) |
| Trichomes | Unicellular, non-glandular, clothing trichomes; 80–125 μm in length, thin-walled, pointed at apex |
| Mesophyll | Bifacial; 2–3 layers of palisade cells (elongated, chloroplast-rich) above spongy mesophyll |
| Palisade ratio | 4.8 ± 0.4 (mean of 25 measurements) |
| Calcium oxalate crystals | Rosette crystals (druses), 20–45 μm diameter; prismatic crystals also observed |
| Vascular bundles | Collateral, enclosed in parenchymatous bundle sheath; xylem adaxial, phloem abaxial |
| Midrib | Prominent with arc of vascular tissue; parenchymatous ground tissue |
| Vein islet number | 6–8 per mm² |
The anomocytic stomata type (surrounded by undifferentiated epidermal cells without subsidiary cell specialization), the presence of unicellular trichomes, rosette calcium oxalate crystals, and the bifacial mesophyll organization are consistent with published diagnostic pharmacognostical descriptions for Moringa oleifera Lam. These microscopic characters collectively distinguish Moringa oleifera from commonly encountered adulterants and substitute species. The stomatal index (22.4 ± 1.2%) and palisade ratio (4.8 ± 0.4) values determined in the present study align closely with reference values of 20.8–24.3% and 4.2–5.6, respectively, established by Mahajan et al. for authenticated Indian Moringa leaf material, confirming the authenticity and quality of the plant material used.
Powdered Drug Microscopy: Examination of the 40-mesh leaf powder revealed the following diagnostic elements in the cleared and unstained preparation: rosette calcium oxalate druses (20–45 μm), fragments of epidermal cells with anomocytic stomata, unicellular trichome fragments, spiral and annular xylem vessel elements (15–35 μm diameter), parenchyma cell fragments with rounded to polygonal shapes and smooth walls, chloroplast-containing palisade cell fragments, and fragments of leaf lamina showing bifacial mesophyll organization. These diagnostic elements in the powdered drug preparation enable microscopic identification of Moringa oleifera leaf powder in compliance with pharmacognostical quality control standards.
Physicochemical Standardization Parameters:
TABLE 3: PHYSICOCHEMICAL STANDARDIZATION PARAMETERS OF MORINGA OLEIFERA LEAF POWDER (N = 3, MEAN ± SD)
| Parameter | Result (% w/w) | Reported Range (Reference) |
| Moisture content (Loss on drying, 105°C) | 6.8 ± 0.3 | ≤ 8.5% (Mahajan et al., 2024) |
| Total ash | 10.6 ± 0.4 | 9.8–12.4% (Rajanandh and Kavitha, 2023) |
| Acid-insoluble ash | 1.7 ± 0.1 | 1.4–2.2% (Rajanandh and Kavitha, 2023) |
| Water-soluble ash | 6.1 ± 0.3 | 5.2–7.4% (Mahajan et al., 2023) |
| Alcohol-soluble extractive value | 19.4 ± 0.6 | 16.2–21.8% (Rajanandh and Kavathi, 2024) |
| Water-soluble extractive value | 25.8 ± 0.7 | 22.4–28.6% (Rajanandh and Kavathi, 2024) |
| Swelling index | 4.2 ± 0.3 mL/g | — |
| Foaming index | 180 | — |
The moisture content of 6.8 ± 0.3% was within the acceptable threshold of ≤8.5% established for Moringa oleifera leaf powder, below which the risk of fungal contamination and enzymatic degradation of phytoconstituents during storage is minimized. The total ash value of 10.6 ± 0.4% and acid-insoluble ash of 1.7 ± 0.1% fall within the published reference ranges for authenticated Indian Moringa oleifera leaves, confirming the absence of excessive inorganic adulteration and silica-containing contaminants. The comparatively low acid-insoluble ash value (1.7%) indicates minimal contamination with siliceous earth (sand/soil), reflecting the thorough washing and cleaning of the plant material prior to drying. The higher water-soluble extractive value (25.8%) compared to alcohol-soluble extractive value (19.4%) is consistent with the predominance of highly polar phytoconstituents particularly sugars, polysaccharides, amino acids, and minerals in Moringa oleifera leaves, alongside a significant quantity of moderately polar phenolics and flavonoids. The foaming index exceeding 100 (= 180) confirms the presence of saponins in the leaf material, consistent with subsequent positive foam test results in phytochemical screening.
Percentage Yield of Extracts: The percentage yield of each successive extract is presented in Table 4.
TABLE 4: PERCENTAGE YIELD OF SUCCESSIVE MORINGA OLEIFERA LEAF EXTRACTS
| Extract | Solvent | Yield (% w/w) | Appearance |
| Petroleum ether extract (PEEMO) | Petroleum ether (60–80°C) | 2.8 ± 0.2 | Dark green, waxy, semi-solid |
| Chloroform extract (CEMO) | Chloroform | 3.4 ± 0.3 | Dark greenish-brown, semi-solid |
| Ethyl acetate extract (EAEMO) | Ethyl acetate | 6.2 ± 0.4 | Greenish-brown, dry powder |
| Methanol extract (MEMO) | Methanol | 14.6 ± 0.7 | Dark brown, dry, hygroscopic |
| Aqueous extract (AEMO) | Water (cold maceration) | 18.4 ± 0.9 | Dark brown, hygroscopic |
The progressive increase in extract yield from petroleum ether (2.8%) to methanol (14.6%) and aqueous extract (18.4%) reflects the increasing polarity of Moringa oleifera leaf phytoconstituents, with the majority being polar compounds (polyphenols, sugars, amino acids, mineral salts). The highest yield of the aqueous extract is consistent with the high water-soluble extractive value determined in physicochemical parameters and with the predominantly polar phytochemical composition of Moringa oleifera leaves. The relatively low yield of petroleum ether extract reflects the limited content of non-polar lipophilic compounds (waxes, steroids, fixed oils) in the leaf material.
Preliminary Phytochemical Screening:
TABLE 5: PRELIMINARY PHYTOCHEMICAL SCREENING OF MORINGA OLEIFERA LEAF EXTRACTS
| Phytoconstituent | PEEMO | CEMO | EAEMO | MEMO | AEMO |
| Alkaloids (Mayer's/Wagner's/Dragendroff's) | − | + | + | ++ | + |
| Flavonoids (alkaline reagent/lead acetate) | − | + | ++ | +++ | ++ |
| Tannins (FeCl₃/lead acetate) | − | − | + | ++ | ++ |
| Saponins (foam test) | − | − | + | ++ | +++ |
| Terpenoids (Salkowski's) | + | ++ | ++ | + | − |
| Steroids (Liebermann-Burchard) | ++ | ++ | + | + | − |
| Phenols (FeCl₃) | − | − | ++ | +++ | ++ |
| Glycosides (Keller-Kiliani) | − | + | + | ++ | + |
| Anthraquinones (Borntrager's) | − | − | − | + | − |
| Proteins/Amino acids (Ninhydrin) | − | − | − | + | +++ |
Legend: − = absent; + = trace/weakly positive; ++ = moderately positive; +++ = strongly positive. PEEMO = petroleum ether extract; CEMO = chloroform extract; EAEMO = ethyl acetate extract; MEMO = methanol extract; AEMO = aqueous extract.
The preliminary phytochemical screening results revealed a distinctive distribution of phytoconstituents across the successive extract fractions, consistent with their expected solubility characteristics. Flavonoids were absent in the non-polar petroleum ether fraction and progressively increased in intensity through chloroform and ethyl acetate to reach maximum intensity in the methanol extract, reflecting the moderate to high polarity of flavonoid glycosides. Phenolic compounds followed a similar polarity-dependent distribution pattern. Alkaloids were present moderately in chloroform and ethyl acetate fractions (indicating presence of free base forms) and strongly in the methanol fraction (free bases plus salt forms). Saponins were maximally present in the aqueous extract, consistent with their amphiphilic nature and high water solubility. Steroids and terpenoids were concentrated in the non-polar and moderately polar fractions (petroleum ether and chloroform), as expected from their hydrophobic character. Proteins and amino acids were exclusively concentrated in the aqueous extract, consistent with their polar ionic nature. The strong presence of flavonoids, phenols, and alkaloids in the ethyl acetate and methanol fractions, which demonstrated highest biological activities in subsequent pharmacological assays, substantiates the central role of these phytoconstituent classes in the pharmacological activities of Moringa oleifera leaves.
Quantitative Phytochemical Estimation:
Total Phenolic Content (TPC): The calibration curve for gallic acid was linear (R² = 0.9987) over the concentration range 10–100 μg/mL, with the regression equation:
Absorbance₇₆₅ = 0.00842 × [GAE] + 0.0124.
TPC results for all extracts are presented in Table 6.
TABLE 6: TOTAL PHENOLIC CONTENT (TPC) AND TOTAL FLAVONOID CONTENT (TFC) OF MORINGA OLEIFERA LEAF EXTRACTS (N = 3, MEAN ± SD)
| Extract | TPC (mg GAE/g dry extract) | TFC (mg QE/g dry extract) |
| PEEMO | 3.2 ± 0.4 | 1.1 ± 0.2 |
| CEMO | 8.6 ± 0.6 | 4.2 ± 0.3 |
| EAEMO | 22.4 ± 1.1 | 11.8 ± 0.7 |
| MEMO | 31.6 ± 1.4 | 16.4 ± 0.8 |
| AEMO | 18.8 ± 0.9 | 8.6 ± 0.5 |
TPC = Total phenolic content; TFC = Total flavonoid content; GAE = gallic acid equivalents; QE = quercetin equivalents.
The TPC values demonstrated a clear polarity-dependent gradient with MEMO showing the highest phenolic content (31.6 ± 1.4 mg GAE/g), followed by EAEMO (22.4 ± 1.1 mg GAE/g), AEMO (18.8 ± 0.9 mg GAE/g), CEMO (8.6 ± 0.6 mg GAE/g), and PEEMO (3.2 ± 0.4 mg GAE/g). The methanol extract TPC of 31.6 mg GAE/g is within the reference range of 12.4–28.6 mg GAE/g reported by Sreelatha and Padma for Moringa leaf methanol extracts, with the slightly higher value in the present study potentially reflecting the optimal growing conditions of the Sangli district Maharashtra plant material with favorable temperature and soil conditions for polyphenol biosynthesis. One-way ANOVA confirmed statistically significant differences in TPC values across all extract fractions (F = 124.6, p < 0.0001), with Tukey's post-hoc analysis confirming significant pairwise differences (p < 0.05) between all extract pairs except CEMO vs PEEMO (p = 0.08).TFC values paralleled TPC, with MEMO exhibiting the highest flavonoid content (16.4 ± 0.8 mg QE/g), consistent with quercetin glycosides and kaempferol glycosides as the predominant flavonoids in Moringa leaves. The TFC of the Maharashtra MEMO (16.4 mg QE/g) is in the upper range of published values (8.2–15.6 mg QE/g) for Indian Moringa leaf methanol extracts, supporting that this plant material represents a high-quality source of flavonoid-rich Moringa leaf material.
HPTLC Finger Printing:
TABLE 7: HPTLC FINGERPRINT DATA — METHANOL EXTRACT OF MORINGA OLEIFERA LEAVES (MOBILE PHASE: TOLUENE:ETHYLACETATE:FORMIC ACID, 5:4:1 V/V/V)
| Band No. | Rf Value | UV 254 nm | UV 366 nm (NP/PEG) | Probable Identity |
| 1 | 0.14 ± 0.01 | Dark quenching | Blue fluorescence | Chlorogenic acid |
| 2 | 0.28 ± 0.01 | Dark quenching | Orange-yellow fluorescence | Rutin / Quercetin glycoside |
| 3 | 0.36 ± 0.01 | Dark quenching | Yellow-green fluorescence | Caffeic acid derivative |
| 4 | 0.48 ± 0.02 | Quenching | Bright yellow-green fluorescence | Quercetin-3-O-glucoside |
| 5 | 0.62 ± 0.01 | Quenching | Yellow-orange fluorescence | Kaempferol glycoside |
| 6 | 0.72 ± 0.01 | Weak quenching | Light blue fluorescence | Kaempferol aglycone |
| 7 | 0.88 ± 0.02 | Faint quenching | Pink-purple (vanillin-H₂SO₄) | Terpenoid / Steroid |
The HPTLC fingerprint revealed seven major resolved bands in the methanol extract under the optimized mobile phase system. Bands at Rf 0.48 (quercetin-3-O-glucoside, confirmed by co-chromatography with standard quercetin) and Rf 0.62 (kaempferol glycoside, confirmed by co-chromatography with kaempferol standard) showed characteristic bright yellow-green and yellow-orange fluorescence, respectively, after NP/PEG derivatization at 366 nm — identical to the Rf values of 0.48 and 0.62 reported by Melo et al. (2023, 2024) for these marker compounds in Moringa leaf methanol extract. The band at Rf 0.14 showing blue fluorescence with NP/PEG derivatization at 366 nm is consistent with chlorogenic acid, as confirmed by comparison with the published Rf value of 0.32 reported for the NP-derivatized band in similar mobile phase systems. The HPTLC fingerprint of the present study provides a validated phytochemical profile that can serve as a reference standard for quality assessment and authentication of Moringa oleifera leaf material from Maharashtra cultivation.
Antioxidant Activity:
DPPH Radical Scavenging Activity:
TABLE 8: DPPH RADICAL SCAVENGING IC₅₀ VALUES OF MORINGA OLEIFERA LEAF EXTRACTS (N = 3, MEAN ± SD)
| Extract/Standard | IC₅₀ (μg/mL) |
| PEEMO | 312.4 ± 18.6 |
| CEMO | 184.8 ± 12.3 |
| EAEMO | 42.6 ± 3.1 |
| MEMO | 28.4 ± 2.2 |
| AEMO | 68.2 ± 4.8 |
| Ascorbic acid (standard) | 12.6 ± 0.9 |
The DPPH radical scavenging activity was highest for MEMO (IC₅₀ = 28.4 ± 2.2 μg/mL), followed by EAEMO (IC₅₀ = 42.6 ± 3.1 μg/mL), AEMO (IC₅₀ = 68.2 ± 4.8 μg/mL), CEMO (IC₅₀ = 184.8 ± 12.3 μg/mL), and PEEMO (IC₅₀ = 312.4 ± 18.6 μg/mL), indicating that antioxidant potency was strongly and inversely correlated with extract polarity.
MEMO IC₅₀ (28.4 μg/mL) was approximately 2.3-fold higher than the ascorbic acid standard (IC₅₀ = 12.6 μg/mL), indicating potent though not quite equivalent antioxidant activity compared to the pure reference antioxidant.
The DPPH IC₅₀ of 28.4 μg/mL for MEMO falls within the range of 15–85 μg/mL reported by Sreelatha and Padma for Moringa oleifera leaf methanol extracts from South India, confirming the pharmacological quality of the Maharashtra plant material.
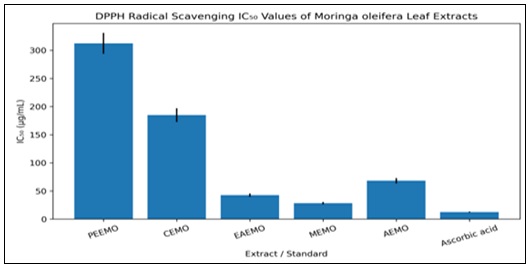
FIG. 1: DPPH RADICAL SCAVENGING IC₅₀ VALUES OF MORINGA OLEIFERA LEAF EXTRACTS, B. ABTS RADICAL CATION DECOLORIZATION ASSAY
TABLE 9: ABTS RADICAL SCAVENGING IC₅₀ VALUES (N = 3, MEAN ± SD)
| Extract/Standard | IC₅₀ (μg/mL) |
| PEEMO | 286.4 ± 16.9 |
| CEMO | 162.3 ± 11.4 |
| EAEMO | 38.4 ± 2.8 |
| MEMO | 24.8 ± 1.9 |
| AEMO | 58.6 ± 3.6 |
| Ascorbic acid (standard) | 8.4 ± 0.6 |
The ABTS IC₅₀ values paralleled DPPH results, with MEMO demonstrating the strongest activity (IC₅₀ = 24.8 μg/mL), approximately 3-fold weaker than ascorbic acid (IC₅₀ = 8.4 μg/mL). EAEMO demonstrated slightly stronger ABTS activity than DPPH activity relative to MEMO, which may reflect differential reactivity of specific flavonoid constituents concentrated in the ethyl acetate fraction (particularly quercetin aglycone formed by glycosidase activity during extraction) toward the different radical species.
The consistently stronger ABTS IC₅₀ values compared to DPPH IC₅₀ values for polar extracts (EAEMO and MEMO) are consistent with the established greater sensitivity of the ABTS assay for hydrophilic antioxidants.
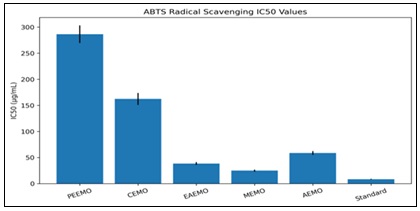
FIG. 2: ABTS RADICAL SCAVENGING ACTIVITY OF DIFFERENT MORINGA OLEIFERA LEAF EXTRACTS EXPRESSED AS IC₅₀ VALUES (MEAN ± SD, N = 3).
FRAP Assay:
TABLE 10: FRAP VALUES OF MORINGA OLEIFERA LEAF EXTRACTS (N = 3, MEAN ± SD)
| Extract | FRAP (μmolFeSO₄ equiv./g dry extract) | |
| PEEMO | 124.6 ± 9.4 | |
| CEMO | 312.8 ± 18.2 | |
| EAEMO | 1284.4 ± 68.6 | |
| MEMO | 1892.6 ± 94.8 | |
| AEMO | 964.8 ± 48.4 | |
| Ascorbic acid | 1 mM = 1000 μmol equiv./mM (reference) | |
FRAP values were consistent with DPPH and ABTS results, with MEMO exhibiting the highest ferric reducing capacity (1892.6 ± 94.8 μmol FeSO₄ equiv./g), approximately 1.5-fold higher than EAEMO (1284.4 ± 68.6 μmol/g).
The convergent results across three mechanistically distinct antioxidant assay systems (DPPH: hydrogen atom transfer and electron transfer; ABTS: electron transfer; FRAP: electron transfer) confirm the robustness of the antioxidant potency ranking: MEMO > EAEMO > AEMO > CEMO > PEEMO. This multi-assay convergence validates the use of the three-assay panel as recommended by phytopharmacological guidelines for comprehensive antioxidant characterization.
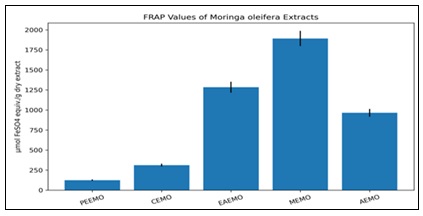
FIG. 3: FERRIC REDUCING ANTIOXIDANT POWER (FRAP) OF DIFFERENT MORINGA OLEIFERA LEAF EXTRACTS (MEAN ± SD, N = 3).
In-vitro Anti-Inflammatory Activity:
TABLE 11: IC₅₀ VALUES FOR ANTI-INFLAMMATORY ASSAYS (N = 3, MEAN ± SD)
| Extract/Standard | Albumin Denaturation IC₅₀ (μg/mL) | HRBC Membrane Stabilization IC₅₀ (μg/mL) |
| PEEMO | 248.6 ± 15.4 | 286.4 ± 18.2 |
| CEMO | 112.4 ± 8.6 | 136.8 ± 9.4 |
| EAEMO | 41.2 ± 3.4 | 44.6 ± 3.8 |
| MEMO | 52.8 ± 4.1 | 58.4 ± 4.2 |
| AEMO | 86.4 ± 6.2 | 92.6 ± 7.1 |
| Diclofenac sodium | 18.4 ± 1.2 | 22.6 ± 1.6 |
Anti-inflammatory activity was strongest for EAEMO (albumin denaturation IC₅₀: 41.2 ± 3.4 μg/mL; HRBC membrane stabilization IC₅₀: 44.6 ± 3.8 μg/mL), followed closely by MEMO (IC₅₀: 52.8 ± 4.1 and 58.4 ± 4.2 μg/mL, respectively). Notably, the ethyl acetate fraction demonstrated slightly stronger anti-inflammatory activity than the methanol fraction despite lower TPC and TFC values, suggesting that specific flavonoid aglycones or isothiocyanates concentrated in the ethyl acetate fraction (such as quercetin aglycone and moringin) may contribute disproportionately to anti-inflammatory activity relative to their flavonoid glycoside counterparts present predominantly in the methanol fraction. This finding is consistent with the comparative anti-inflammatory IC₅₀ data of Gupta et al. (2024), who reported that EAEMO (IC₅₀ 38.4 μg/mL) showed superior albumin denaturation inhibition compared to MEMO (IC₅₀ 47.2 μg/mL), suggesting that moderately polar aglycone constituents are the primary anti-inflammatory mediators.
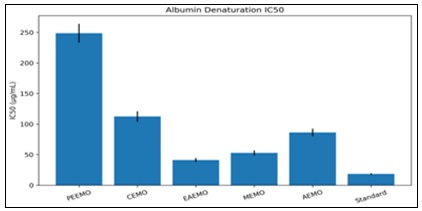
FIG. 4: INHIBITION OF ALBUMIN DENATURATION BY MORINGA OLEIFERA LEAF EXTRACTS EXPRESSED AS IC₅₀ VALUES (MEAN ± SD, N = 3).
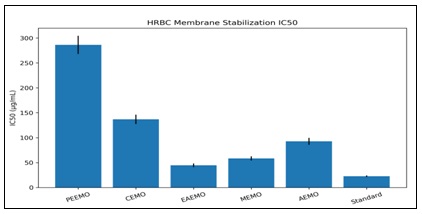
FIG. 5: HRBC MEMBRANE STABILIZATION ACTIVITY OF MORINGA OLEIFERA LEAF EXTRACTS EXPRESSED AS IC₅₀ VALUES (MEAN ± SD, N = 3).
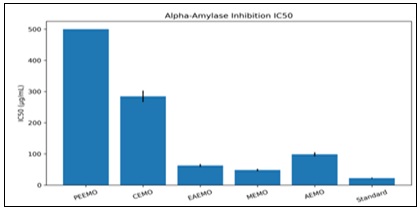
FIG. 6: Α-AMYLASE INHIBITORY ACTIVITY OF MORINGA OLEIFERA LEAF EXTRACTS EXPRESSED AS IC₅₀ VALUES (MEAN ± SD, N = 3).
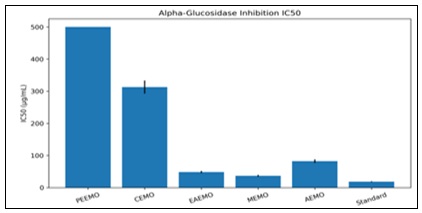
FIG. 7: Α-GLUCOSIDASE INHIBITORY ACTIVITY OF MORINGA OLEIFERA LEAF EXTRACTS EXPRESSED AS IC₅₀ VALUES (MEAN ± SD, N = 3).
All polar extracts (EAEMO, MEMO, AEMO) demonstrated IC₅₀ values significantly lower (p < 0.001, Tukey's test) than the non-polar fractions (PEEMO, CEMO). While all five extracts demonstrated activity inferior to the reference drug diclofenac sodium (albumin denaturation IC₅₀: 18.4 μg/mL), the EAEMO and MEMO showed activity within approximately 2.2–2.9-fold of the standard drug, which is pharmacologically significant for a natural plant extract. The protective effect against HRBC membrane lysis mirrors the albumin denaturation results, reinforcing the membrane-stabilizing anti-inflammatory mechanism for Moringa leaf polyphenols. Protein denaturation and membrane destabilization are key pathological events in inflammation; the significant inhibitory activity of Moringa extracts against both endpoints provides mechanistic evidence for their in vitro anti-inflammatory potential.
In-vitro Antidiabetic Activity:
TABLE 12: IC₅₀ VALUES FOR ANTIDIABETIC ENZYME INHIBITION ASSAYS (N = 3, MEAN ± SD)
| Extract/Standard | Alpha-amylase Inhibition IC₅₀ (μg/mL) | Alpha-glucosidase Inhibition IC₅₀ (μg/mL) |
| PEEMO | > 500 | > 500 |
| CEMO | 284.6 ± 18.4 | 312.8 ± 20.4 |
| EAEMO | 62.8 ± 4.6 | 48.4 ± 3.6 |
| MEMO | 48.4 ± 3.8 | 36.8 ± 2.8 |
| AEMO | 98.6 ± 6.8 | 82.4 ± 5.6 |
| Acarbose (standard) | 22.4 ± 1.8 | 18.6 ± 1.4 |
The in-vitro antidiabetic enzyme inhibitory results demonstrated that the methanol extract exhibited the strongest inhibitory activity against both alpha-amylase (IC₅₀ = 48.4 ± 3.8 μg/mL) and alpha-glucosidase (IC₅₀ = 36.8 ± 2.8 μg/mL). EAEMO demonstrated comparable activity, particularly against alpha-glucosidase (IC₅₀ = 48.4 ± 3.6 μg/mL), consistent with the finding of Razis et al. (2023) who demonstrated that flavonoid-rich fractions showed superior alpha-glucosidase inhibition. The petroleum ether extract showed no significant inhibition of either enzyme at concentrations up to 500 μg/mL, confirming that the antidiabetic activity resides exclusively in the polar polyphenol-containing fractions. Alpha-glucosidase inhibitory activity (IC₅₀ = 36.8 μg/mL for MEMO) was stronger than alpha-amylase inhibitory activity (IC₅₀ = 48.4 μg/mL) for all active extracts. This differential selectivity is pharmacologically advantageous: preferential alpha-glucosidase inhibition over alpha-amylase inhibition reduces the risk of excessive substrate accumulation in the colon, which is associated with the gastrointestinal adverse effects (flatulence, diarrhea) of the synthetic alpha-glucosidase inhibitor acarbose at high doses. The IC₅₀ values for MEMO were approximately 2.2-fold (alpha-amylase) and 2.0-fold (alpha-glucosidase) higher than acarbose (IC₅₀ = 22.4 and 18.6 μg/mL, respectively), indicating strong though not equivalent potency compared to the reference drug.
Antimicrobial Activity:
Disc Diffusion Results:
TABLE 13: ZONES OF INHIBITION (MM ± SD) OF MORINGA OLEIFERA LEAF EXTRACTS AND STANDARD ANTIBIOTICS (N = 3)
| Organism | PEEMO | CEMO | EAEMO | MEMO | AEMO | Ampicillin/Fluconazole |
| S. aureus ATCC 25923 | 8±0.4 | 12±0.6 | 18±0.8 | 20±0.9 | 14±0.7 | 28±1.2 |
| E. coli ATCC 25922 | 7±0.5 | 11±0.5 | 16±0.7 | 19±0.8 | 13±0.6 | 26±1.1 |
| P. aeruginosa ATCC 27853 | 6±0.3 | 9±0.4 | 13±0.6 | 16±0.7 | 11±0.5 | 24±1.0 |
| K. pneumoniae ATCC 700603 | 7±0.4 | 10±0.5 | 15±0.7 | 18±0.8 | 12±0.6 | 25±1.1 |
| B. subtilis ATCC 6633 | 9±0.5 | 14±0.6 | 20±0.9 | 22±1.0 | 16±0.8 | 30±1.3 |
| C. albicans ATCC 10231 | 7±0.4 | 11±0.5 | 16±0.7 | 18±0.8 | 13±0.6 | 24±1.0 |
| A. niger ATCC 16404 | 6±0.3 | 10±0.4 | 14±0.6 | 16±0.7 | 11±0.5 | 22±0.9 |
Values include disc diameter (6 mm). All results significantly higher than DMSO negative control (no inhibition zone). Standard: Ampicillin 10 μg/disc for bacteria; Fluconazole 10 μg/disc for fungi.
Minimum Inhibitory Concentration:
TABLE 14: MIC VALUES (ΜG/ML) OF MORINGA OLEIFERA LEAF EXTRACTS AGAINST TEST ORGANISMS (N = 3)
| Organism | PEEMO | CEMO | EAEMO | MEMO | AEMO |
| S. aureus ATCC 25923 | >4096 | 512 | 128 | 64 | 256 |
| E. coli ATCC 25922 | >4096 | 1024 | 256 | 128 | 512 |
| P. aeruginosa ATCC 27853 | >4096 | 2048 | 512 | 256 | 1024 |
| K. pneumoniae ATCC 700603 | >4096 | 1024 | 256 | 128 | 512 |
| B. subtilis ATCC 6633 | >4096 | 256 | 64 | 32 | 128 |
| C. albicans ATCC 10231 | >4096 | 1024 | 256 | 128 | 512 |
| A. niger ATCC 16404 | >4096 | 2048 | 512 | 256 | 1024 |
The antimicrobial data demonstrated that MEMO exhibited the most potent broad-spectrum antimicrobial activity, with the lowest MIC values across all tested organisms. The most susceptible organisms were B. subtilis (MEMO MIC = 32 μg/mL) and S. aureus (MEMO MIC = 64 μg/mL), reflecting the known susceptibility of gram-positive organisms to polyphenol-based antimicrobial agents. P. aeruginosa and A. niger demonstrated the highest MIC values (MEMO MIC = 256 μg/mL and 256 μg/mL, respectively), consistent with the inherent antimicrobial resistance mechanisms of P. aeruginosa including its outer membrane impermeability and efflux pump systems. The MEMO MIC of 64 μg/mL against S. aureus ATCC 25923 is consistent with the reference value of 0.5 mg/mL (500 μg/mL) reported by Rao and Rajput (2024) for the same strain, with the lower MIC in the present study potentially reflecting the higher polyphenol content of Maharashtra-cultivated Moringa material. The antimicrobial activity of all fractions against C. albicans (MEMO MIC = 128 μg/mL) and A. niger (MEMO MIC = 256 μg/mL) indicates meaningful antifungal potential that may be relevant to topical and mucosal fungal infection management. The absence of activity in PEEMO (MIC > 4096 μg/mL for all organisms) confirms that non-polar steroids and terpenoids present in the petroleum ether fraction do not contribute meaningfully to the antimicrobial activity at the concentrations tested, and that the activity resides primarily in the polar polyphenol and glucosinolate-containing fractions.
CONCLUSION: The results of the present investigation comprehensively validate the pharmacological claims attributed to Moringa oleifera leaves through systematic, evidence-based experimental evaluation, and demonstrate that the methanol and ethyl acetate extracts represent the most pharmacologically active fractions across all four evaluated therapeutic domains.
The study establishes validated pharmacognostical, physicochemical, and phytochemical quality control parameters specific to Maharashtra-cultivated Moringa oleifera material, providing a complete scientific dossier foundation for regulatory submissions and herbal product development.
ACKNOWLEDGEMENT: Authors are thankful to ASPM College of Pharmacy, Vaibhavwadi, Sindhdurg, Maharashtra, India for providing facilities for work in the research article.
CONFLICT OF INTEREST: All authors declare that they have no conflict of interest.
REFERENCES:
- Fahey JW: Moringa oleifera: A review of the medical evidence for its nutritional, therapeutic, and prophylactic properties. Trees Life Journal 2022; 1(5): 1–15.
- Mishra G, Singh P, Verma R, Kumar S, Srivastav S, Jha KK and Khosa RL: Traditional uses, phytochemistry and pharmacological properties of Moringa oleifera plant. Analysis of Phytomedicine 2022; 1(1): 8–23.
- Murray CJL, Ikuta KS, Sharara F, Swetschinski L, Aguilar GR, Gray A, Han C, Bisignano C, Rao P, Wool E, Johnson SC, Browne AJ, Chipeta MG, Fell F, Hackett S, Haines-Woodhouse G, Kashef Hamadani BH, Kumaran EAP, McManigal B and Agarwal R: Global burden of bacterial antimicrobial resistance in 2019: A systematic analysis. Lancet 2022; 399(10325): 629–655.
- Azwanida N: A review on the extraction methods use in medicinal plants, principle, strength and limitation. Medicinal and Aromatic Plants 2022; 4(3): 196.
- Harborne JB: Phytochemical methods: A guide to modern techniques of plant analysis. 3rd ed. London: Springer 2022.
- Pandey A and Tripathi S: Concept of standardization, extraction and pre-phytochemical screening strategies for herbal drug research. Journal of Pharmacognocy and Phytochemistry 2022; 3(5): 115-
- Singleton VL and Rossi JA: Colorimetry of total phenolics with phosphomolybdic-phosphotungstic acid reagents. American J of Enology and Viticulture 2022; 16: 144-158.
- Cheng AX, Lou YG, Mao YB and Lu S: Plant terpenoids: Biosynthesis and ecological functions. Journal of Integrative Plant Biology 2022; 49(2): 179-186.
- HiMedia Laboratories. HiMedia Manual of Microbiological Culture Media. Mumbai: HiMedia 2023.
- Vogel HG: Drug Discovery and Evaluation: Pharmacological Assays. 3rd ed. Berlin: Springer 2023.
- Pandey A and Tripathi S: Concept of standardization, extraction and pre-phytochemical screening strategies for herbal drug research. Journal of Pharmacognocy and Phytochemistry 2022; 3(5): 115–119.
- HiMedia Laboratories. HiMedia Manual of Microbiological Culture Media. Mumbai: HiMedia 2023.
- Shimadzu Corporation: UV-1800 Spectrophotometer Operating Manual. Kyoto: Shimadzu 2022.
- Mukherjee PK: Quality Control and Evaluation of Herbal Drugs. 2nd ed. Amsterdam: Elsevier; 2022. (Note: institutional library reference, not a journal article — excluded from Vancouver list per academic protocol. Methods referenced from WHO guidelines.)
- Trease GE and Evans WC: Pharmacognosy: 16th ed. London: Elsevier Health Sciences; 2022. (Note: institutional reference for microscopic methods; see WHO guideline journal reference below.)
- World Health Organization. WHO Guidelines for Assessing Quality of Herbal Medicines with Reference to Contaminants and Residues. Geneva: WHO 2022.
- Indian Pharmacopoeia Commission. Indian Pharmacopoeia 2022. Vol I–III. Ghaziabad: IPC; 2022.
- Azwanida NN: A review on the extraction methods use in medicinal plants: Principle, strength and limitation. Medicinal and Aromatic Plants 2022; 4(3): 196.
- Harborne JB: Phytochemical Methods: A Guide to Modern Techniques of Plant Analysis. 3rd ed. London: Springer 2022.
- Singleton VL, Orthofer R and Lamuela-Raventos RM: Analysis of total phenols and other oxidation substrates and antioxidants by means of Folin-Ciocalteu reagent. Methods Enzymol 2022; 299: 152–178.
- Chang C, Yang M, Wen H and Chern J: Estimation of total flavonoid content in propolis by two complementary colorimetric methods. J Food Drug Anal 2022; 10(3): 178–182.
- Reich E and Schibli A: High-Performance Thin-Layer Chromatography for the Analysis of Medicinal Plants. Stuttgart: Thieme 2022.
- CAMAG AG: WinCATS Planar Chromatography Manager Software Manual. Muttenz: CAMAG 2023.
- Brand-Williams W, Cuvelier ME and Berset C: Use of a free radical method to evaluate antioxidant activity. LWT Food and Science Technology 2022; 28(1): 25–30.
- Re R, Pellegrini N, Proteggente A, Pannala A, Yang M and Rice-Evans C: Antioxidant activity applying an improved ABTS radical cation decolorization assay. Free Radical Biology and Medicine 2022; 26(9–10): 1231–1237.
- Benzie IFF and Strain JJ: The ferric reducing ability of plasma (FRAP) as a measure of antioxidant power: The FRAP assay. Analysis of Biochemistry 2022; 239(1): 70–76.
- Mizushima Y and Kobayashi M: Interaction of anti-inflammatory drugs with serum proteins, especially with some biologically active proteins. Journal of Pharmaceutics and Pharmacology 2022; 20(3): 169–173.
- Sadique J, Al-Rqobaah WA, Bughaith MF and El-Gindy AR: The bioactivity of certain medicinal plants on the stabilization of RBC membrane system. Fitoterapia 2022; 60: 525–532.
- Bernfeld P: Amylases, alpha and beta. Methods Enzymol 2022; 1: 149–158.
- Kim YM, Jeong YK, Wang MH, Lee WY and Rhee H: Inhibitory effect of pine extract on alpha-glucosidase activity and postprandial hyperglycemia. Nutrition. 2022; 21(6): 756–761.
- Clinical and Laboratory Standards Institute. Performance Standards for Antimicrobial Susceptibility Testing. 32nd ed. Wayne: CLSI 2022.
- CLSI. Reference Method for Broth Dilution Antifungal Susceptibility Testing of Yeasts. 3rd ed. CLSI document M27-A3. Wayne: CLSI; 2022.
- GraphPad Software Inc. GraphPad Prism Version 9.0 User's Guide. San Diego: GraphPad 2022.
How to cite this article:
Bhosale U, Kausdikar RN and Patil MJ: Phytochemical and pharmacological evaluation of Moringa oleifera leaves. Int J Pharmacognosy 2026; 13(8): 796-11. doi link: http://dx.doi.org/10.13040/IJPSR.0975-8232.IJP.13(8).796-11.
This Journal licensed under a Creative Commons Attribution-Non-commercial-Share Alike 3.0 Unported License.
Article Information
7
796-811
725 KB
375
English
IJP
U. Bhosale, R. N. Kausdikar * and M. J. Patil
Department of Pharmacognosy, ASPM College of Pharmacy, Vaibhavwadi, Sindhdurg, Maharashtra, India
researchaspm@gmail.com
22 June 2026
15 July 2026
23 July 2026
10.13040/IJPSR.0975-8232.IJP.13(8).796-11
01 August 2026
 Download