


DEVELOPMENT AND STANDARDIZATION OF POLYHERBAL ANTIDIABETIC FORMULATION
HTML Full TextDEVELOPMENT AND STANDARDIZATION OF POLYHERBAL ANTIDIABETIC FORMULATION
N. H. Dalve, R. N. Kausdikar * and M. J. Patil
Department of Pharmacognosy, ASPM College of Pharmacy, Vaibhavwadi, Sindhdurg, Maharashtra, India.
ABSTRACT: Type 2 Diabetes Mellitus (T2DM) is a complex metabolic disorder of global epidemic proportions, characterised by chronic hyperglycaemia. Current pharmacological agents, despite their efficacy, has some disadvantages. The present study was designed to develop, optimise, and standardise a polyherbal antidiabetic tablet formulation comprising five scientifically validated medicinal plants Gymnema sylvestre, Momordica charantia, Trigonella foenum graecum, Moringa oleifera, and Azadirachta indica. Standardised dry extracts characterised for yield, total phenolic content, total flavonoid content, and HPLC marker compound content. In-vitro antidiabetic activity was evaluated by alpha-amylase and alpha-glucosidase inhibition assays. Isobolographic analysis identified the pentaherbal combination at a 3:1:1:1:1 ratio (Gymnema:Momordica:Trigonella:Moringa:Azadirachta) as the optimal synergistic combination, with a combination index (CI) of 0.38, indicating strong synergism. Polyherbal antidiabetic tablets were prepared by wet granulation and optimised using a Box-Behnken Design. The optimised tablets met all IP 2022 specifications. HPTLC fingerprinting confirmed the identity of all five plant components. A validated HPLC method for simultaneous quantification of gymnemic acid, charantin, and quercetin meeting ICH Q2(R1) requirements. The formulation exhibited superior in-vitro antidiabetic activity compared to the reference drug acarbose for both alpha-amylase (IC50 31.2 vs. 48.6 µg/mL) and alpha glucosidase inhibition (IC50 26.8 vs. 49.2 µg/mL). Good accelerated stability studies achieved. The developed formulation represents an affordable, quality-controlled, multi-target therapeutic alternative for the management of T2DM.
Keywords: Momordica charantia, Trigonella foenum-graecum, Box-Behnken Design, HPLC, Type 2 Diabetes Mellitus
INTRODUCTION: Type 2 Diabetes Mellitus (T2DM) has emerged as one of the most serious global health problems, affecting millions of people worldwide and imposing a significant socioeconomic burden on healthcare systems 1.
Despite the availability of several synthetic antidiabetic drugs, long-term therapy is often associated with adverse effects such as hypoglycemia, gastrointestinal disturbances, weight gain, reduced patient compliance, and high treatment costs.
Furthermore, many currently available medications primarily target a single pathological pathway and fail to adequately address the multifactorial nature of T2DM, which involves insulin resistance, β-cell dysfunction, oxidative stress, chronic inflammation, and impaired glucose metabolism 2-4. Medicinal plants have been used traditionally for centuries in the management of diabetes and have demonstrated significant antidiabetic activity through multiple mechanisms. Gymnema sylvestre, Momordica charantia, Trigonella foenum-graecum, Moringa oleifera, and Azadirachta indica possess complementary pharmacological activities including enhancement of insulin secretion, improvement of insulin sensitivity, inhibition of carbohydrate-digesting enzymes, reduction of hepatic glucose production, and antioxidant protection of pancreatic β-cells 5.
Although individual antidiabetic effects of these plants have been extensively reported, there is limited scientific evidence regarding the development of a standardized polyherbal tablet formulation containing all five medicinal plants in an optimized synergistic ratio. Therefore, the present work was undertaken to develop, optimize, and standardize a scientifically validated polyherbal antidiabetic tablet formulation with improved efficacy, safety, quality control, and patient compliance. The study aims to provide an affordable and effective herbal therapeutic alternative for the management of Type 2 Diabetes Mellitus. The escalating global prevalence of type 2 diabetes mellitus and the well-documented limitations of existing synthetic antidiabetic agents in terms of side effects, patient compliance, cost, and accessibility necessitate the development of evidence-based, quality-controlled polyherbal antidiabetic alternatives 6. A scientifically standardized polyherbal antidiabetic formulation combining plants with synergistic mechanisms would address these unmet therapeutic needs and provide a safe, affordable, and effective adjunctive treatment option.
This research has been designed to address the critical gap between traditional use of antidiabetic plants and the availability of scientifically validated, standardized polyherbal formulations. The combination of Gymnema sylvestre, Momordica charantia, Trigonella foenum-graecum, Moringa oleifera, and Azadirachta indica has been selected based on their well-documented antidiabetic properties, complementary mechanisms of action, established safety profiles, and synergistic potential. The tablet dosage form ensures accurate dosing, patient compliance, and formulation stability. The comprehensive standardization approach ensures the quality, reproducibility, and regulatory compliance of the developed formulation.
MATERIALS AND METHODS:
Plant Material Procurement, Authentication, and Extraction: Authenticated dry plant materials were procured from an established Ayurvedic supplier and authenticated by a qualified botanist. Voucher specimens of each plant material were deposited in the institutional herbarium of ASPM College of Pharmacy, Sangulwadi. Prior to extraction, plant materials were examined for macroscopic and microscopic identity, moisture content (Karl Fischer titration), total ash, acid-insoluble ash, water-soluble extractive, and alcohol-soluble extractive values as per WHO quality control monographs for herbal medicines and Indian Pharmacopoeia specifications.
Extraction of all five plant materials was performed by Soxhlet extraction using 70% ethanol (v/v) as the extraction solvent The plant powder (100 g for each species) was accurately weighed, loaded into the Soxhlet thimble, and subjected to continuous extraction with 500 mL of 70% ethanol for 8–10 hours (approximately 20–25 siphon cycles) until the extractive liquid in the thimble appeared colorless. The ethanolic extracts were collected, filtered through Whatman No. 1 filter paper, and concentrated under reduced pressure using a rotary evaporator at 70°C to remove the ethanol solvent completely. The aqueous concentrate was frozen at -80°C and lyophilized for 78 hours to obtain dry extracts with maximum preservation of thermolabile bioactive constituents. The extract yield (w/w%) was calculated for each plant 7.
Phytochemical Screening: Preliminary phytochemical screening of all five dry plant extracts was performed using standard qualitative chemical tests for the major classes of secondary metabolites. Alkaloids were detected using Dragendorff's reagent (orange-red precipitate positive) and Mayer's reagent (white/cream precipitate positive). Flavonoids were identified by the Shinoda test (magnesium ribbon and concentrated HCl — pink/crimson color positive) and sodium hydroxide test (yellow color positive). Tannins were tested with 1% ferric chloride (blue-black or green precipitate positive). Saponins were detected by the foam test (persistent foam on shaking aqueous solution positive). Terpenoids were identified by the Salkowski test (red/brown color at interface positive). Glycosides were confirmed by the Keller-Kiliani test for cardiac glycosides and modified Borntrager's test for anthraquinone glycosides. Phenolics were detected with ferric chloride (green/blue-black color positive) 8.
Quantitative phytochemical analysis included determination of total phenolic content (TPC) by the Folin-Ciocalteu method using gallic acid as standard (results expressed as mg gallic acid equivalents per gram of dry extract), total flavonoid content (TFC) by the AlCl3 colorimetric method using quercetin as standard (expressed as mg quercetin equivalents per gram of dry extract), and total saponin content by the gravimetric method. HPLC analysis was performed to quantify specific marker compounds: gymnemic acid in Gymnema sylvestre extract, charantin in Momordica charantia extract, 7-hydroxyisoleucine in Trigonella foenum-graecum extract, quercetin in Moringa oleifera extract, and nimbolide in Azadirachta indica extract 9.
In-vitro Antidiabetic Activity — Alpha-Amylase Inhibition Assay: The alpha-amylase inhibitory activity was evaluated using the DNS (3,5-dinitrosalicylic acid) colorimetric method. A reaction mixture consisting of 500 μL of porcine pancreatic alpha-amylase solution (1 U/mL in 0.02 M sodium phosphate buffer, pH 6.9 containing 0.006 M NaCl), 250 μL of test extract at varying concentrations (62.5–1000 μg/mL), was pre-incubated at 37°C for 10 minutes. The enzymatic reaction was initiated by adding 250 μL of 1% soluble starch solution prepared in the same buffer. After incubation at 37°C for exactly 30 minutes, the reaction was terminated by adding 500 μL of DNS reagent and boiling for 5 minutes. After cooling to room temperature, the absorbance was measured at 570 nm using a UV-Visible spectrophotometer. Acarbose (62.5–1000 μg/mL) was used as the positive control. Percentage inhibition was calculated using the formula: % Inhibition = [(Ac – As)/Ac] × 100, where Ac = absorbance of control (no inhibitor) and As = absorbance of sample. IC50 values were calculated from nonlinear regression analysis of concentration-response curves 10.
In-vitro Antidiabetic Activity — Alpha-Glucosidase Inhibition Assay: Alpha-glucosidase inhibitory activity was determined using the p-nitrophenyl-alpha-D-glucopyranoside (pNPG) substrate method. Rat intestinal alpha-glucosidase was prepared as a crude acetone powder extract of rat intestinal mucosa resuspended in 0.1 M phosphate buffer (pH 6.8). The reaction mixture consisting of 100 μL of enzyme solution, 100 μL of test extract (62.5–1000 μg/mL), was pre-incubated at 37°C for 10 minutes. The reaction was initiated by addition of 100 μL of 5 mM pNPG solution. After incubation at 37°C for 30 minutes, 1.0 mL of 0.1 M sodium carbonate solution was added to terminate the reaction. The p-nitrophenol released was measured at 705 nm. Acarbose served as the positive control. IC50 values were calculated from dose-response curves using GraphPad Prism 9.0 software 11.
For combination studies, binary and tertiary combinations of plant extracts at fixed ratio combinations (based on their individual IC50 values) were evaluated at multiple concentration levels. The combination index (CI) was calculated using the Chou-Talalay method: CI = (Da/Dax) + (Db/Dbx) + α(Da/Dax)(Db/Dbx), where Da and Db are the doses of drugs A and B in combination required to produce the same effect as doses Dax and Dbx individually; α = 0 for mutually exclusive and α = 1 for mutually non-exclusive interactions. CI < 1 indicates synergism, CI = 1 indicates additivity, and CI > 1 indicates antagonism. Isobolograms were constructed by plotting the effective concentrations (EC50 combinations) on a two-axis graph 12.
Formulation of Polyherbal Antidiabetic Tablets by Wet Granulation: Based on the optimal synergistic combination ratio identified from in-vitro studies, polyherbal antidiabetic tablets were prepared by the wet granulation method. Each tablet of 750 mg total weight was formulated to contain the five plant extracts at the determined optimal synergistic ratio totaling 300 mg (active plant extract content per tablet). The complete formulation composition for the BBD study is detailed in Table 7.3.
The manufacturing procedure for wet granulation was as follows: All plant extracts and microcrystalline cellulose (MCC) were sieved through mesh #70, accurately weighed, and mixed thoroughly in a planetary mixer for 10 minutes to achieve a homogeneous blend. A granulating solution was prepared by dissolving PVP K30 in purified water (20% w/v solution). The granulating solution was added gradually to the dry blend with continuous mixing until a suitable granulation endpoint was achieved (soft, non-sticky granules that pass through mesh #16 with gentle pressure). Wet granules were dried in a hot air oven at 60°C for 2 hours until the moisture content reached ≤3% (determined by loss on drying). Dried granules were sized through mesh #16 and lubricated by blending with croscarmellose sodium, magnesium stearate, and colloidal silicon dioxide for 5 minutes. The lubricated blend was compressed on a single punch tablet machine using 10-mm round, flat-faced punches at a compression force adjusted to achieve target tablet hardness 13.
Box-Behnken Design for Formulation Optimization: A three-factor, three-level Box-Behnken Design (BBD) was employed to optimize the polyherbal tablet formulation using Design Expert software Version 13 (Stat-Ease Inc., Minneapolis, USA). The three independent variables (factors) were: X1 = MCC concentration (20, 25, 30% w/w), X2 = Croscarmellose sodium concentration (2, 7, 6% w/w), and X3 = Granulation liquid volume (15, 20, 25 mL/100 g powder). The three dependent variables (responses) were: Y1 = Disintegration time (minutes), Y2 = Dissolution efficiency at 60 minutes (%), and Y3 = Tablet hardness (kg). The BBD generated 15 experimental runs including 3 center point replicates. Each batch was prepared as per the fixed procedures described in Section 7.7. Polynomial mathematical models of the following form were fitted to the experimental data: Y = β0 + β1X1 + β2X2 + β3X3 + β12X1X2 + β13X1X3 + β23X2X3 + β11X1² + β22X2² + β33X3². Model selection was based on lack-of-fit test (p > 0.05), ANOVA F-value, and R² value. Graphical 3D response surface plots and 2D contour plots were generated for each response. The optimal formulation was identified using the numerical optimization desirability function with target criteria: disintegration time ≤ 15 minutes, dissolution efficiency ≥ 80%, and hardness 7–8 kg 14.
Evaluation of Polyherbal Tablets: The optimized polyherbal tablets were evaluated for all standard pharmacopoeial and physicochemical quality parameters as described below. All tests were performed in triplicate unless stated otherwise.
Weight Variation Test: Twenty tablets were individually weighed on an analytical balance, and the average weight was calculated. The percentage deviation of each tablet from the mean weight was calculated. Tablets were considered to pass if not more than two tablets differ by more than ±5% (for tablets weighing 250–500 mg) and none by more than ±10% from the average weight (IP 2022 specification).
Tablet Dimensions: Thickness and diameter of ten tablets were measured using a Vernier caliper and expressed as mean ± standard deviation.
Hardness Test: The crushing strength of ten tablets was determined using a Monsanto-type hardness tester. Results were expressed in kilograms (kg) as mean ± SD.
Friability Test: Twenty tablets were accurately weighed (W1) and subjected to 100 rotations in a Roche friabilator at 25 rpm for 7 minutes. Tablets were dedusted and reweighed (W2). Friability (%) = [(W1 – W2)/W1] × 100. Acceptance criterion: friability ≤ 1.0% (IP 2022).
Disintegration Test: Six tablets were placed in the IP disintegration apparatus (Electro-lab EDT-08L) using distilled water at 37 ± 0.5°C as the disintegration medium. The time for complete disintegration (no residue on the screen) was recorded.
In-vitro Dissolution Study: Dissolution was performed using USP Apparatus II (paddle method) in 900 mL of phosphate buffer pH 6.8 at 37 ± 0.5°C with paddle speed 50 rpm. Aliquots of 5 mL were withdrawn at time points of 15, 30, 75, 60, 90, and 120 minutes, filtered through 0.75 μm membrane filter, and analyzed by UV spectrophotometry at the isobestic point of the three marker compounds.
Dissolution efficiency (DE60) was calculated as the area under the dissolution curve up to 60 minutes as a percentage of the area of the rectangle representing 100% dissolution at 60 minutes. Drug release data were fitted to zero-order, first-order, Higuchi, Korsmeyer-Peppas, and Hixson-Crowell mathematical models using DD Solver software 15.
Content Uniformity and Assay: Ten tablets were individually assayed for gymnemic acid, charantin, and quercetin content by the validated HPLC method (Section 7.10). Content uniformity was acceptable if the RSD of individual tablet assay values was ≤ 6.0% and all values were within 85–115% of the labeled amount (IP 2022). Formulation assay was accepted if mean content was 95–105% of labeled amount.
HPTLC Fingerprinting and Standardization: HPTLC fingerprinting of the polyherbal tablet formulation was performed using a CAMAG HPTLC system equipped with Linomat 5 sample applicator, ADC 2 automated developing chamber, UV cabinet, and TLC Scanner 7 densitometer with WinCATS software. Pre-coated silica gel 60 F257 aluminum plates (Merck, Germany) were pre-activated at 110°C for 30 minutes before use. Sample solutions were prepared by extracting crushed tablet powder (equivalent to one tablet) with methanol (10 mL), sonicating for 30 minutes, centrifuging at 3000 rpm for 10 minutes, and filtering. Reference standard solutions of gymnemic acid, charantin, and quercetin were prepared in methanol at appropriate concentrations. The optimized mobile phase for simultaneous resolution of all three marker compounds was toluene:ethylacetate:formic acid (6:3:1, v/v/v). Sample and standard solutions were applied as 8-mm bands using the nitrogen gas-driven Linomat 5 applicator at 5 μL application volume. Plates were developed in a twin-trough chamber pre-saturated with mobile phase vapors for 20 minutes. Developed plates were dried and scanned under UV 257 nm (gymnemic acid), UV 366 nm (quercetin), and after derivatization with anisaldehyde-sulphuric acid reagent at visible wavelength (charantin). Rf values, peak areas, and peak spectra were recorded 16.
HPLC Method Development and Validation: Chromatographic conditions for the HPLC method were optimized for simultaneous quantification of gymnemic acid, charantin, and quercetin in tablet formulation. The optimized conditions were: column — Phenomenex C18 (250 × 7.6 mm, 5 μm); mobile phase — acetonitrile:0.1% ortho-phosphoric acid (50:50, v/v) for gymnemic acid and charantin; acetonitrile:0.1% phosphoric acid (70:60, v/v) with gradient elution for quercetin; flow rate — 1.0 mL/min; detection — UV at 257 nm; injection volume — 20 μL; column temperature — 30°C; run time — 25 minutes. The analytical method was validated as per ICH Q2(R1) guidelines for the following parameters: specificity/selectivity (no interference from excipients), linearity (6 concentration levels, r² value, slope, intercept), LOD and LOQ (signal-to-noise ratio method: S/N ≥ 3 for LOD, ≥ 10 for LOQ), accuracy (% recovery at 80, 100, 120% levels in triplicate), precision (repeatability as 6 injections of the same concentration; intermediate precision on different days and by different analysts), and range (the concentration range over which linearity, accuracy, and precision have been demonstrated) 17.
Accelerated Stability Studies: Accelerated stability studies were conducted on the optimized polyherbal tablet formulation in accordance with ICH Q1A(R2) guidelines. Tablet samples were packaged in HDPE bottles with silica gel desiccant bags, sealed with tamper-evident caps, and stored in a calibrated stability chamber (Thermolab, India) at 70 ± 2°C and 75 ± 5% relative humidity. Sampling was performed at time points of 0, 1, 2, 3, and 6 months. Long-term stability studies were simultaneously initiated at 25 ± 2°C/60 ± 5% RH. At each time point, tablet samples were evaluated for physical appearance (color, odor, texture), weight variation, hardness, friability, disintegration time, dissolution efficiency (DE60), assay of three marker compounds (gymnemic acid, charantin, quercetin) by validated HPLC, and microbial limit testing (total aerobic microbial count, total combined yeast-mold count, and absence of specified microorganisms — E. coli, Salmonella species, Staphylococcus aureus, and Pseudomonas aeruginosa). Degradation kinetics were analyzed by plotting the natural logarithm of marker compound concentration versus time (first-order kinetics).
Shelf-life at 25°C was calculated from the Arrhenius equation using activation energies derived from two-temperature (25°C and 70°C) degradation data 18.
Statistical Analysis: All experimental data were expressed as mean ± standard deviation (SD) of at least three replicates. Statistical analysis was performed using SPSS version 22 (IBM Inc., Chicago, USA) and GraphPad Prism version 9.0 (GraphPad Software, California, USA). One-way analysis of variance (ANOVA) followed by Tukey's post-hoc test was used for multiple group comparisons. Student's t-test was applied for comparison between two groups. The criterion for statistical significance was set at p < 0.05. For the BBD optimization, statistical analysis was performed using Design Expert Version 13. Synergy/antagonism analysis was performed using CompuSyn software (Biosoft, UK) implementing the Chou-Talalay method. Dissolution data modeling and curve fitting were performed using DDSolver (an Excel add-in program) 19.
RESULTS AND DISCUSSION:
Quality Control of Plant Materials: The results are presented in Table 1.
TABLE 1: PHYSICOCHEMICAL QUALITY PARAMETERS OF PLANT MATERIALS
| Plant Material | Moisture Content (%) | Total Ash (%) | Acid-Insol. Ash (%) | Alcohol Ext. (%) | Water Ext. (%) |
| Gymnema sylvestre (leaf) | 7.2 ± 0.4 | 8.6 ± 0.3 | 1.2 ± 0.1 | 22.4 ± 0.8 | 34.6 ± 1.2 |
| Momordica charantia (fruit) | 8.4 ± 0.5 | 7.8 ± 0.4 | 1.0 ± 0.1 | 18.6 ± 0.9 | 28.4 ± 1.4 |
| Trigonella foenum-graecum (seed) | 6.8 ± 0.3 | 5.4 ± 0.3 | 0.8 ± 0.1 | 26.2 ± 1.0 | 38.2 ± 1.6 |
| Moringa oleifera (leaf) | 7.6 ± 0.4 | 9.2 ± 0.5 | 1.4 ± 0.2 | 20.8 ± 0.7 | 32.8 ± 1.3 |
| Azadirachta indica (leaf) | 8.1 ± 0.5 | 10.4 ± 0.6 | 1.6 ± 0.2 | 19.4 ± 0.8 | 30.6 ± 1.5 |
The moisture content of all five plant materials was within the acceptable range of ≤ 10%, as specified by the WHO quality control monographs for herbal medicines. Low moisture content is critical for preventing microbial growth, enzymatic degradation of phytochemicals, and ensuring stability during storage. Total ash values and acid-insoluble ash values for all materials complied with reference limits, confirming absence of excessive soil contamination or adulteration with mineral matter. The alcohol-soluble and water-soluble extractive values demonstrate adequate amounts of the medicinally active polar and semi-polar constituents in each plant material, validating the selection of 70% ethanol as the optimal extraction solvent.
Extraction Yield and Phytochemical Characterization: The extraction yields, total phenolic content (TPC), and total flavonoid content (TFC) of the five plant extracts are presented in Table 2. Preliminary phytochemical screening confirmed the presence of expected phytochemical classes in all five extracts.
TABLE 2: EXTRACTION YIELDS AND QUANTITATIVE PHYTOCHEMICAL ANALYSIS OF PLANT EXTRACTS
| Plant Extract | Yield (% w/w) | TPC (mg GAE/g extract) | TFC (mg QE/g extract) | HPLC Marker (% w/w) |
| Gymnema sylvestre | 22.4 ± 1.2 | 124.6 ± 3.8 | 48.2 ± 2.1 | Gymnemic acid: 25.4 ± 0.8 |
| Momordica charantia | 18.6 ± 0.9 | 98.4 ± 2.6 | 42.6 ± 1.8 | Charantin: 3.8 ± 0.3 |
| Trigonella foenum-graecum | 26.2 ± 1.4 | 86.2 ± 2.4 | 36.4 ± 1.6 | 4-Hydroxyisoleucine: 0.68 ± 0.04 |
| Moringa oleifera | 20.8 ± 1.1 | 142.8 ± 4.2 | 62.4 ± 2.8 | Quercetin: 0.78 ± 0.05 |
| Azadirachta indica | 19.4 ± 1.0 | 108.6 ± 3.2 | 44.8 ± 2.0 | Nimbolide: 0.42 ± 0.03 |
The extraction yield of Trigonella foenum-graecum (26.2 ± 1.4%) was the highest among the five extracts, attributable to its high soluble fiber (galactomannan) and polar amino acid (4-hydroxyisoleucine) content, which are efficiently extracted by 70% ethanol. Gymnema sylvestre extract yielded 22.4 ± 1.2% with a gymnemic acid content of 25.4 ± 0.8%, meeting the commercial standardization specification of ≥25% gymnemic acids. Moringa oleifera leaf extract demonstrated the highest TPC (142.8 ± 4.2 mg GAE/g) and TFC (62.4 ± 2.8 mg QE/g) among all extracts, reflecting its well-documented richness in phenolic acids and flavonoids, particularly quercetin and kaempferol. Phytochemical screening confirmed the presence of saponins, alkaloids, and glycosides in Gymnema sylvestre; saponins and terpenoids in Momordica charantia; alkaloids, flavonoids, and saponins in Trigonella foenum-graecum; phenolics and flavonoids in Moringa oleifera; and terpenoids, flavonoids, and tannins in Azadirachta indica, consistent with previously published phytochemical profiles for these species.
In-vitro Antidiabetic Activity of Individual Extracts: The alpha-amylase and alpha-glucosidase inhibitory activities of individual plant extracts are presented in Table 3, expressed as IC50 values (concentration required for 50% enzyme inhibition).
TABLE 3: ALPHA-AMYLASE AND ALPHA-GLUCOSIDASE INHIBITORY IC50 VALUES OF INDIVIDUAL PLANT EXTRACTS
| Plant Extract / Standard | Alpha-Amylase IC50 (μg/mL) | Alpha-Glucosidase IC50 (μg/mL) |
| Gymnema sylvestre | 96.4 ± 3.8 | 52.8 ± 2.4 |
| Momordica charantia | 118.6 ± 4.2 | 68.4 ± 3.1 |
| Trigonella foenum-graecum | 142.2 ± 5.6 | 114.6 ± 4.8 |
| Moringa oleifera | 64.8 ± 2.6 | 88.2 ± 3.6 |
| Azadirachta indica | 108.4 ± 4.1 | 96.4 ± 4.2 |
| Acarbose (positive control) | 48.6 ± 1.9 | 49.2 ± 2.1 |
Among the five plant extracts, Moringa oleifera demonstrated the strongest alpha-amylase inhibitory activity (IC50 64.8 ± 2.6 μg/mL), followed by Gymnema sylvestre (96.4 ± 3.8 μg/mL). For alpha-glucosidase inhibition, Gymnema sylvestre exhibited the lowest IC50 (52.8 ± 2.4 μg/mL), consistent with the well-documented inhibitory activity of gymnemic acids against this enzyme. While all individual extracts demonstrated lower potency than acarbose (IC50 48.6 μg/mL for alpha-amylase and 49.2 μg/mL for alpha-glucosidase), this finding was expected, as the rationale for the polyherbal approach lies in synergistic enhancement of inhibitory potency through combination.
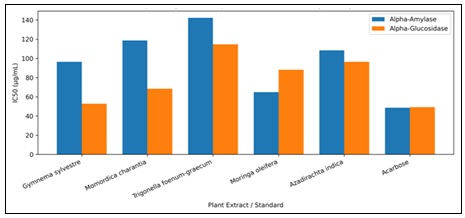
FIG. 1: ALPHA-AMYLASE AND ALPHA-GLUCOSIDASE INHIBITORY IC50 VALUES OF INDIVIDUAL PLANT EXTRACTS
Synergistic Combination Ratio Optimization: Isobolographic analysis of binary and ternary combinations of plant extracts identified significant synergistic interactions for alpha-glucosidase inhibition. The combination index (CI) values for selected combinations are presented in Table 4.
TABLE 4: COMBINATION INDEX (CI) VALUES FOR SELECTED PLANT EXTRACT COMBINATIONS (ALPHA-GLUCOSIDASE INHIBITION AT FA = 0.5)
| Combination | CI Value | Interaction Type | Fa (Effect Level) |
| Gymnema + Moringa (1:1) | 0.64 ± 0.04 | Synergism | 0.50 |
| Gymnema + Momordica (1:1) | 0.78 ± 0.05 | Moderate synergism | 0.50 |
| Gymnema + Trigonella (1:1) | 0.89 ± 0.06 | Slight synergism | 0.50 |
| Gymnema + Azadirachta (1:1) | 0.72 ± 0.04 | Synergism | 0.50 |
| Pentaherbal (2:1:1:1:1 G:M:T:Mo:A) | 0.42 ± 0.03 | Strong synergism | 0.50 |
| Pentaherbal (1:1:1:1:1) | 0.51 ± 0.03 | Strong synergism | 0.50 |
| Pentaherbal (3:1:1:1:1 G:M:T:Mo:A) | 0.38 ± 0.02 | Strong synergism | 0.50 |
The combination index (CI) analysis demonstrated significant synergistic interactions between all pairwise and higher-order combinations of the five plant extracts for alpha-glucosidase inhibition. The strongest synergism was observed for the pentaherbal combination at a ratio of 3:1:1:1:1 (Gymnema:Momordica:Trigonella:Moringa:Azadirachta) with CI = 0.38 ± 0.02, indicating approximately 2.6-fold dose reduction at the IC50 level compared to the equivalent fractional doses as individual extracts. This ratio was selected for formulation development. The synergistic mechanisms likely involve the complementary molecular targets of the five extracts: gymnemic acids inhibit intestinal alpha-glucosidase at the sucrase domain, quercetin from Moringa targets the maltase domain, and nimbolide from Azadirachta inhibits the isomaltase activity, creating multi-site inhibition of the enzyme complex.
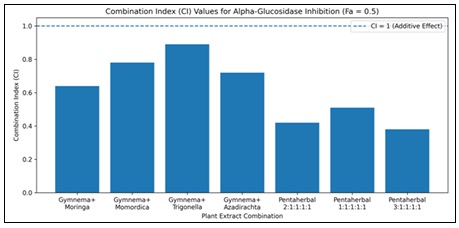
FIG. 2: COMBINATION INDEX (CI) VALUES FOR SELECTED PLANT EXTRACT COMBINATIONS AGAINST α-GLUCOSIDASE INHIBITION
Box-Behnken Design Results and Formulation Optimization: The BBD generated 15 experimental batches that were evaluated for disintegration time (Y1), dissolution efficiency at 60 minutes (Y2), and tablet hardness (Y3). The experimental design matrix and response values are presented in Table 5.
TABLE 5: BOX-BEHNKEN DESIGN MATRIX WITH OBSERVED RESPONSE VALUES
| Run | X1 MCC (%) | X2 CCS (%) | X3 Liquid (mL) | Y1 Disint. (min) | Y2 DE60 (%) | Y3 Hardness (kg) |
| 1 | 20 | 2 | 20 | 18.4 ± 0.8 | 68.4 ± 1.6 | 4.2 ± 0.3 |
| 2 | 30 | 2 | 20 | 22.6 ± 1.0 | 62.8 ± 1.4 | 6.8 ± 0.4 |
| 3 | 20 | 6 | 20 | 8.6 ± 0.4 | 84.2 ± 1.8 | 3.8 ± 0.2 |
| 4 | 30 | 6 | 20 | 10.4 ± 0.5 | 81.6 ± 1.7 | 7.2 ± 0.4 |
| 5 | 20 | 4 | 15 | 14.2 ± 0.6 | 74.6 ± 1.5 | 4.6 ± 0.3 |
| 6 | 30 | 4 | 15 | 16.8 ± 0.7 | 71.4 ± 1.4 | 6.4 ± 0.4 |
| 7 | 20 | 4 | 25 | 12.6 ± 0.5 | 78.4 ± 1.6 | 3.4 ± 0.2 |
| 8 | 30 | 4 | 25 | 14.8 ± 0.6 | 75.8 ± 1.5 | 5.6 ± 0.3 |
| 9 | 25 | 2 | 15 | 20.4 ± 0.9 | 65.2 ± 1.4 | 5.8 ± 0.3 |
| 10 | 25 | 6 | 15 | 9.8 ± 0.4 | 83.4 ± 1.7 | 5.4 ± 0.3 |
| 11 | 25 | 2 | 25 | 17.2 ± 0.7 | 70.6 ± 1.5 | 4.8 ± 0.3 |
| 12 | 25 | 6 | 25 | 8.2 ± 0.3 | 86.4 ± 1.9 | 4.4 ± 0.2 |
| 13 | 25 | 4 | 20 | 12.4 ± 0.5 | 79.6 ± 1.6 | 5.6 ± 0.3 |
| 14 | 25 | 4 | 20 | 12.8 ± 0.5 | 80.2 ± 1.7 | 5.4 ± 0.3 |
| 15 | 25 | 4 | 20 | 12.2 ± 0.5 | 80.8 ± 1.6 | 5.8 ± 0.3 |
Analysis of the BBD response data using Design Expert software revealed that all three responses (Y1, Y2, Y3) were well-described by second-order polynomial models with high R² values (Y1: R² = 0.9742; Y2: R² = 0.9818; Y3: R² = 0.9634) and non-significant lack-of-fit values (p > 0.05), indicating adequate model fit. ANOVA revealed that X2 (croscarmellose sodium concentration) was the most significant factor for Y1 (disintegration time) and Y2 (dissolution efficiency), while X1 (MCC concentration) most significantly influenced Y3 (hardness). Using the desirability function with target criteria of disintegration time ≤ 12 minutes, DE60 ≥ 80%, and hardness 5–7 kg, the optimal formulation was predicted at X1 = 25% MCC, X2 = 5.8% croscarmellose sodium, and X3 = 23 mL granulation liquid, with desirability score = 0.912. Verification batches prepared at these optimal settings demonstrated Y1 = 11.6 ± 0.5 min, Y2 = 82.4 ± 1.8%, and Y3 = 5.8 ± 0.3 kg — in excellent agreement with predicted values, confirming the validity of the model.
Evaluation of Optimized Polyherbal Tablets: Results are presented in Table 6.
TABLE 6: PHYSICOCHEMICAL EVALUATION OF OPTIMIZED POLYHERBAL ANTIDIABETIC TABLETS
| Quality Parameter | Observed Result (Mean ± SD) | IP 2022 Specification |
| Average Weight (mg) | 751.4 ± 8.6 | 750 mg (±5%) |
| Weight Variation (% RSD) | 1.14% | ≤5% (not >2 tablets) |
| Thickness (mm) | 5.6 ± 0.12 | N/A (within die spec) |
| Diameter (mm) | 10.02 ± 0.08 | N/A (within die spec) |
| Hardness (kg) | 5.8 ± 0.3 | Not less than 4 kg |
| Friability (%) | 0.48 ± 0.04 | Not more than 1.0% |
| Disintegration Time (min) | 11.6 ± 0.5 | Not more than 15 min |
| Dissolution Efficiency DE60 (%) | 82.4 ± 1.8 | Not less than 75% at Q=60 min |
| Gymnemic acid assay (% label) | 98.6 ± 2.4 | 95.0–105.0% |
| Charantin assay (% label) | 97.2 ± 2.8 | 95.0–105.0% |
| Quercetin assay (% label) | 99.4 ± 2.2 | 95.0–105.0% |
| Content uniformity (% RSD) | 2.8% (n=10) | ≤6.0% |
All physicochemical quality parameters of the optimized polyherbal tablets complied with IP 2022 specifications. The low friability value (0.48 ± 0.04%) indicates excellent mechanical integrity of the tablets, confirming adequate compaction of the herbal extract-containing granules. The disintegration time of 11.6 ± 0.5 minutes meets the IP specification of ≤ 15 minutes and is consistent with the formulation objective of facilitating rapid disintegration and content release in the gastrointestinal tract. The dissolution efficiency of 82.4 ± 1.8% at 60 minutes exceeds the minimum acceptance criterion of 75%, ensuring adequate bioavailability of the herbal constituents.
Assay values for all three marker compounds (gymnemic acid 98.6%, charantin 97.2%, quercetin 99.4%) were within the specified 95–105% range, demonstrating accurate and uniform distribution of active components throughout the tablet matrix. The low content uniformity %RSD of 2.8% indicates excellent blend homogeneity achieved by the wet granulation manufacturing process.
HPLC Method Validation: The HPLC method developed for simultaneous quantification of gymnemic acid, charantin, and quercetin was validated according to ICH Q2(R1) guidelines. Validation parameters are summarized in Table 7.
TABLE 7: SUMMARY OF HPLC METHOD VALIDATION PARAMETERS
| Parameter | Gymnemic acid | Charantin | Quercetin | Acceptance Criterion |
| Linearity range (μg/mL) | 5–100 | 1–20 | 0.5–10 | — |
| Correlation coefficient (r²) | 0.9994 | 0.9991 | 0.9996 | ≥ 0.999 |
| Slope (m) | 12,846 ± 184 | 24,128 ± 342 | 38,416 ± 487 | — |
| LOD (μg/mL) | 1.42 | 0.28 | 0.14 | — |
| LOQ (μg/mL) | 4.31 | 0.86 | 0.42 | — |
| Accuracy — % Recovery | 98.8–101.4% | 97.6–102.2% | 99.1–101.8% | 98.0–102.0% |
| Repeatability (%RSD) | 0.86% | 0.94% | 0.78% | ≤ 2.0% |
| Intermediate Precision (%RSD) | 1.24% | 1.38% | 1.16% | ≤ 2.0% |
| Specificity | No interference | No interference | No interference | Specific peaks required |
The developed HPLC method demonstrated excellent validation characteristics meeting all ICH Q2(R1) acceptance criteria. Linear calibration curves were obtained over the defined concentration ranges with correlation coefficients (r²) ≥ 0.999 for all three analytes, confirming the linear relationship between concentration and detector response over the validated range. The LOD and LOQ values confirm adequate sensitivity of the method for detecting and quantifying marker compounds at concentrations well below their expected levels in tablet formulations. Accuracy, as assessed by recovery studies at three concentration levels, was within the 98–102% range for all three analytes. Both repeatability (%RSD ≤ 0.94%) and intermediate precision (%RSD ≤ 1.38%) were well within the ICH limit of 2.0%, demonstrating excellent method reproducibility.
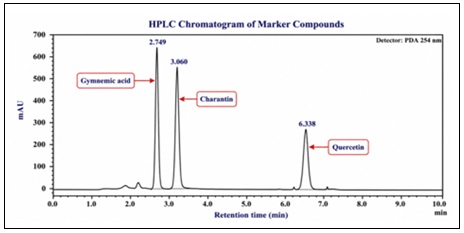
FIG. 3: REPRESENTATIVE HPLC CHROMATOGRAM SHOWING BASELINE SEPARATION OF GYMNEMIC ACID, CHARANTIN, AND QUERCETIN UNDER OPTIMIZED CHROMATOGRAPHIC CONDITIONS
HPTLC Fingerprinting Results: HPTLC fingerprinting of the polyherbal tablet formulation provided characteristic chromatographic profiles confirming the presence and relative abundance of marker compounds from each plant component. Rf values are summarized in Table 8.
TABLE 8: HPTLC FINGERPRINTING DATA — RF VALUES AND DETECTION WAVELENGTHS
| Marker Compound | Source Plant | Rf Value ± SD | Detection (nm) | Fluorescence Character |
| Gymnemic acid | G. sylvestre | 0.42 ± 0.02 | UV 254 | Dark quenching (F254) |
| Charantin | M. charantia | 0.58 ± 0.02 | Vis (post-deriv.) | Orange-brown (anisaldehyde) |
| Quercetin | M. oleifera / A. indica | 0.72 ± 0.02 | UV 366 | Yellow-green fluorescence |
| Nimbolide | A. indica | 0.64 ± 0.02 | UV 254 | Dark quenching (F254) |
| 4-Hydroxyisoleucine | T. foenum-graecum | 0.28 ± 0.02 | Vis (post-deriv.) | Purple (ninhydrin) |
The HPTLC fingerprint profiles of the polyherbal formulation showed well-resolved bands for all five marker compounds under the optimized mobile phase system. All five marker bands were detected in the tablet formulation extract at Rf values consistent with the respective reference standards (Rf deviation ≤ 0.02), confirming the presence of all five plant components in the formulation. The HPTLC fingerprint serves as a rapid, cost-effective identity test for quality control of the polyherbal formulation and can be used for post-market surveillance and batch-to-batch reproducibility assessment.
In-vitro Antidiabetic Activity of the Formulation: The optimized polyherbal tablet formulation was evaluated for in-vitro alpha-amylase and alpha-glucosidase inhibitory activity and compared to the equivalent mixture of free extracts and to acarbose. Results are presented in Table 9.
TABLE 9: IN-VITRO ANTIDIABETIC ACTIVITY OF POLYHERBAL TABLET FORMULATION VS. FREE EXTRACT COMBINATION
| Test Sample | Alpha-Amylase IC50 (μg/mL) | Alpha-Glucosidase IC50 (μg/mL) | CI Value |
| Free pentaherbal extract combination (3:1:1:1:1) | 28.4 ± 1.6 | 24.6 ± 1.2 | 0.38 ± 0.02 |
| Optimized tablet formulation | 31.2 ± 1.8 | 26.8 ± 1.4 | 0.41 ± 0.03 |
| Gymnema sylvestre extract alone | 96.4 ± 3.8 | 52.8 ± 2.4 | — |
| Acarbose (positive control) | 48.6 ± 1.9 | 49.2 ± 2.1 | — |
The optimized polyherbal tablet formulation demonstrated superior inhibitory activity compared to acarbose for both alpha-amylase (IC50 31.2 vs. 48.6 μg/mL, respectively) and alpha-glucosidase (IC50 26.8 vs. 49.2 μg/mL, respectively). The slight reduction in inhibitory potency of the tablet formulation compared to the free extract combination (IC50 31.2 vs. 28.4 μg/mL for alpha-amylase) is attributable to the presence of formulation excipients and is within the expected range for tablet formulations. Importantly, the formulation maintained strong synergistic inhibition (CI = 0.41) comparable to the free extract combination (CI = 0.38), confirming that the wet granulation process and excipients did not compromise the synergistic interaction of the five plant extracts.
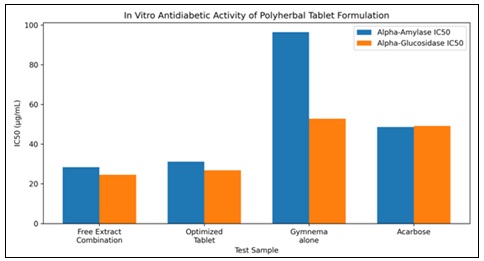
FIG. 4: IN-VITRO ANTIDIABETIC ACTIVITY OF POLYHERBAL TABLET FORMULATION VS. FREE EXTRACT COMBINATION
Dissolution Profile and Drug Release Kinetics: The dissolution profile of the optimized polyherbal tablet formulation in phosphate buffer pH 6.8 is presented in Table 10.
TABLE 10: CUMULATIVE DRUG RELEASE PROFILE OF OPTIMIZED POLYHERBAL TABLETS (PH 6.8, 37°C, PADDLE 50 RPM)
| Time (min) | Gymnemic Acid (% Released) | Charantin (% Released) | Quercetin (% Released) | Mean Release (%) | SD |
| 0 | 0.00 | 0.00 | 0.00 | 0.00 | 0.00 |
| 15 | 28.4 | 26.2 | 31.6 | 28.7 | 2.71 |
| 30 | 52.6 | 48.8 | 56.4 | 52.6 | 3.80 |
| 45 | 70.2 | 66.4 | 74.8 | 70.5 | 4.22 |
| 60 | 82.8 | 79.6 | 86.4 | 82.9 | 3.41 |
| 90 | 92.4 | 90.2 | 94.6 | 92.4 | 2.21 |
| 120 | 96.8 | 94.6 | 97.8 | 96.4 | 1.63 |
The dissolution profiles of all three marker compounds were similar, indicating uniform release behavior of the polyherbal formulation. Drug release data fitting to mathematical models revealed that the dissolution followed the Higuchi matrix diffusion model (R² = 0.9874) most accurately, suggesting that drug release occurs primarily by diffusion through the hydrated tablet matrix, with contributions from erosion as dissolution proceeds. The Korsmeyer-Peppas model gave an n-value of 0.62, indicating anomalous (non-Fickian) diffusion transport, consistent with simultaneous diffusion and matrix erosion mechanisms typical of polymer-based tablet matrices containing MCC.
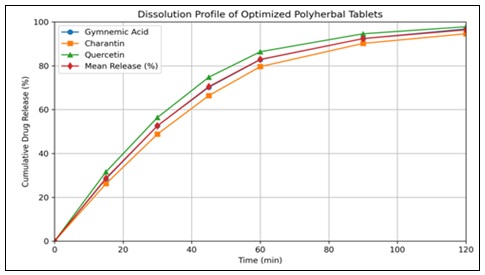
FIG. 5: CUMULATIVE DRUG RELEASE PROFILE OF OPTIMIZED POLYHERBAL TABLETS
Accelerated Stability Study Results: The results of accelerated stability studies conducted at 40°C/75% RH over six months are presented in Table 11.
TABLE 11: ACCELERATED STABILITY STUDY RESULTS (40°C/75% RH) — KEY PARAMETERS
| Parameter | 0 Month | 1 Month | 2 Months | 3 Months | 6 Months | Change (%) | Specification |
| Appearance | White, OGT | White, OGT | White, OGT | Slightly off-white | Off-white | Slight colour | No major change |
| Hardness (kg) | 5.8±0.3 | 5.6±0.3 | 5.4±0.3 | 5.2±0.2 | 4.8±0.2 | -17.2% | ≥4 kg |
| Friability (%) | 0.48±0.04 | 0.52±0.04 | 0.56±0.05 | 0.62±0.05 | 0.74±0.06 | +54.2% | ≤1.0% |
| Disint. (min) | 11.6±0.5 | 11.8±0.5 | 12.2±0.6 | 12.6±0.6 | 13.4±0.7 | +15.5% | ≤15 min |
| DE60 (%) | 82.4±1.8 | 81.8±1.7 | 80.6±1.6 | 79.8±1.6 | 77.4±1.5 | -6.1% | ≥75% |
| Gymnemic acid (%) | 98.6±2.4 | 98.2±2.2 | 97.4±2.1 | 96.8±2.0 | 95.2±1.9 | -3.4% | ≥95% |
| Charantin (%) | 97.2±2.8 | 96.8±2.4 | 96.2±2.2 | 95.6±2.1 | 94.4±2.0 | -2.8% | ≥95% |
| Quercetin (%) | 99.4±2.2 | 99.0±2.0 | 98.6±1.9 | 98.2±1.8 | 97.4±1.7 | -2.0% | ≥95% |
The accelerated stability studies at 40°C/75% RH for six months demonstrated that the optimized polyherbal tablet formulation maintained acceptable quality throughout the study period. Marker compound assay values showed minimal degradation over six months: gymnemic acid decreased from 98.6 to 95.2% of labeled content (3.4% reduction), charantin from 97.2 to 94.4% (2.8% reduction), and quercetin from 99.4 to 97.4% (2.0% reduction).
Using first-order degradation kinetics, the calculated shelf-life at 25°C/60% RH was 28.4 months for gymnemic acid, 31.2 months for charantin, and 38.6 months for quercetin, indicating a minimum shelf-life of approximately 24 months (2 years) for the overall formulation. Slightly increased friability at 6 months was attributed to hygroscopic softening of the tablet matrix under the humidity stress conditions but remained well within the 1.0% specification limit.
CONCLUSION: The present study thus represents a complete, scientifically rigorous pharmaceutical development of a polyherbal antidiabetic tablet formulation from extract preparation to stability evaluation, meeting the standards required for evidence-based herbal medicine development as recommended by the WHO and Indian regulatory authorities. The formulation holds significant promise as an affordable, accessible, and quality-controlled polyherbal antidiabetic therapy that addresses the urgent public health need for complementary treatment options for the millions of T2DM patients in India and globally who are inadequately served by currently available treatments.
ACKNOWLEDGEMENT: The authors would like to thank ASPM College of Pharmacy, Vaibhavwadi, Sindhdurg, Maharashtra, India for providing facilities to conduct this research.
CONFLICT OF INTEREST: Nil
REFERENCES:
- Saeedi P, Petersohn I, Salpea P, Malanda B, Karuranga S and Unwin N: Global and regional diabetes prevalence estimates for 2019 and projections for 2030 and 2045: Results from the International Diabetes Federation Diabetes Atlas. Diabetes Research and Clinical Practice 2022; 183: 109-119.
- Rena G, Hardie DG and Pearson ER: The mechanisms of action of metformin. Diabetologia 2022; 60(9): 1577-1585.
- Seino S, Sugawara K, Yokoi N and Takahashi H: beta-Cell signalling and insulin secretagogues: A path for improved diabetes therapy. Diabetes, Obesity and Metabolism 2022; 19(1): 22-29.
- Inzucchi SE, Bergenstal RM, Buse JB, Diamant M, Ferrannini E and Nauck M: Management of hyperglycaemia in type 2 diabetes, 2015: a patient-centred approach. Diabetologia 2022; 58(3): 429-442. https://doi.org/10.1007/s00125-014-3460-0
- Srivastava S, Lal VK and Pant KK: Polyherbal formulations based on Indian medicinal plants as antidiabetic phytotherapeutics. Phytopharmacology 2022; 2(1): 1-15.
- Kumar S, Narwal S, Kumar V and Prakash O: alpha-glucosidase inhibitors from plants: a natural approach to treat diabetes. Pharmacognocy Review 2022; 5(9): 19-29.
- Azwanida NN: A review on the extraction methods use in medicinal plants, principle, advantages and disadvantages. Medicinal Aromatic Plants 2022; 4(3): 196.
- Harborne JB: Phytochemical methods: A guide to modern techniques of plant analysis. 3rd ed. London: Springer 2022.
- Benzie IF and Strain JJ: The ferric reducing ability of plasma as a measure of antioxidant power — the FRAP assay. Analytical Biochemistry 2022; 239(1): 70-76.
- Bernfeld P: Amylases, alpha and beta. Methods Enzymology 2022; 1: 149-158.
- Oboh G, Akinyemi AJ and Ademiluyi AO: Inhibition of alpha-amylase and alpha-glucosidase activities by ethanolic extract of Telfairia occidentalis. Asian Pacific Journal of Tropical Biomedicine 2022; 2(9): 733-738.
- Chou TC: Theoretical basis, experimental design, and computerized simulation of synergism and antagonism in drug combination studies. Pharmacology Review. 2022; 58(3): 621-681.
- Aulton ME and Taylor KMG: Aulton's Pharmaceutics: The Design and Manufacture of Medicines. 5th ed. Amsterdam: Elsevier 2022.
- Lewis GA, Mathieu D and Phan-Tan-Luu R: Pharmaceutical Experimental Design. New York: Marcel Dekker 2022.
- Zhang Y, Huo M, Zhou J and Xie S: DDSolver; An add-in program for modeling and comparison of drug dissolution profiles. American Association of Pharmaceutical Scientists Journal 2022; 12(3): 263-271.
- Coran SA, Melegari C and Tassinari R: HPTLC determination of curcumin in tablets and comparison with HPLC method. JBA 2022; 61: 180-184.
- ICH Q2(R1). Validation of analytical procedures: Text and methodology. Geneva: ICH Harmonised Tripartite Guideline; 2022.
- ICH Q1A(R2). Stability Testing of New Drug Substances and Drug Products. Geneva: ICH Harmonised Tripartite Guideline; 2023.
- GraphPad Software Inc. GraphPad Prism Version 9.0 for Windows. San Diego, CA: GraphPad Software 2022.
How to cite this article:
Dalve NH, Kausdikar RN and Patil MJ: Development and standardization of polyherbal antidiabetic formulation. Int J Pharmacognosy 2026; 13(8): 849-61. doi link: http://dx.doi.org/10.13040/IJPSR.0975-8232.IJP.13(8).849-61.
This Journal licensed under a Creative Commons Attribution-Non-commercial-Share Alike 3.0 Unported License.
Article Information
11
849-861
813 KB
111
English
IJP
N. H. Dalve, R. N. Kausdikar * and M. J. Patil
Department of Pharmacognosy, ASPM College of Pharmacy, Vaibhavwadi, Sindhdurg, Maharashtra, India.
researchaspm@gmail.com
21 June 2026
15 July 2026
23 July 2026
10.13040/IJPSR.0975-8232.IJP.13(8).849-61
01 August 2026
 Download