


TOXICOLOGICAL STUDY OF THE METHANOL LEAF EXTRACT OF BAPHIA PUBESCENS HOOK, F. FAMILY LEGUMINOSAE
HTML Full TextTOXICOLOGICAL STUDY OF THE METHANOL LEAF EXTRACT OF BAPHIA PUBESCENS HOOK, F. FAMILY LEGUMINOSAE
Anowi Chinedu Fredrick *, Ezea Charity Chinasa and C. C. A. Azikiwe
Department of Pharmacognosy and Traditional Medicine, Nnamdi Azikiwe University Awka, Nigeria.
ABSTRACT: Since time immemorial, natural products have been the backbone of traditional system of healing throughout the globe and have also been an integral part of history and culture. Hence Baphia pubescence has been used ethnomedicinally to treat various diseases. The leaf or leaf juice is applied against parasitic skin diseases. A leaf infusion is drunk to cure enteritis and other gastrointestinal problems. The leaves and bark are considered haemostatic and anti-inflammatory and are used for healing sores and wounds. The leaves infusion is used to treat malarial infections as well as other microbial infections. As a result, it is pertinent to study the toxicity of the plant. The toxicological study both acute and chronic were evaluated according to standard methods. Acute andChronic toxicity studies of B. pubescens indicated that the plant is relatively safe at the therapeutic dose. The toxicity of the plant was shown to be dose dependent. The kidney and liver enzymes increased with increasing doses whereas the histopathological damage after long administration on these organs was mild.
Keywords: Toxicity, Enzymes, Anti-inflammatory, Baphia pubescense
INTRODUCTION:
Medicinal uses of B. Pubescens: The leaf or leaf juice is applied against parasitic skin diseases. A leaf infusion is drunk to cure enteritis and other gastrointestinal problems (FAO, 1996) 11. In Ghana, Cote d’Ivoire and Nigeria the leaves and bark are considered haemostatic and anti-inflammatory and are used for healing sores and wounds (Akande et al 2001) 1. In Cote d’ Ivoire powdered leaves are taken with palm wine or food to cure venereal diseases, and leaf sap is applied as eye drops against jaundice.
An extract of young leaves with some salt and red pepper is used as nose drops against headache. In Nigeria powdered herbs is made into an ointment with shea butter (obtained from the seeds of Vitellaria paradoxa) which is applied against stiff and swollen joints, sprains and rheumatic complaints. In Sierra Leone, a bark decoction is drunk to cure cardinal pain and bark and leaves are prepared as an enema to treat constipation (Kumar et al 2008) 13.
MATERIALS AND METHODS:
Solvents: Solvents used in general procedures include diethyl ether, ethyl acetate, ethanol, and methanol. HPLC solvents include methanol (LiChroSolv HPLC grade, Merck, Germany), distilled and heavy metal free water [obtained by passing through nano- and ion-exchange filter cells (Barnstead) to yield nanopure water].
Glass Wares: Glass slides, test tubes, beakers, measuring cylinders, capillary tubes, etc.
Equipment: Microscope; Counting Chamber; Haemocytometer; Micro-hematocrit centrifuge SH120; rotary evaporator; Electronic weighing balance (NAPCO Precision Instruments JA-410); water bath; thermostat oven (DHG-9023A, PEC MEDICAL USA); UV-spectrophotometer (Model 721); analytical HPLC [the analytical HPLC components include: pump (P580A LPG, Dionex, Germany).
Others: Oral cannula, Standard Cages, Cotton wool and Hand gloves, 5mL hypodermic syringe, Vital top feed (Jos, Nigeria), Dissecting kits, EDTA container and Plain Container, Micro haematocrit Reader, Plasticine, Neubaur, Whatman Filter papers.
Test Animals: Male Wistar rats housed in the animal house, College of Health Sciences, Nnewi Campus, Nnamdi Azikiwe University, Anambra State were used in this study. Animals were kept in standard cages at a room temperature of 27±2°C. The animals were kept on 12 h light and dark cycles. The animals were allowed free access to food and water ad libitum and were placed in standard Laboratory animal house condition.
Test Organisms: Chloroquine sensitive strain of Plasmodium berghei (strain ANKA) was obtained from the National Institute for Pharmaceutical Research and Development (NIPRID) Abuja, Nigeria, as cryo-frozen stock of parasitized red blood cells (PRBCs).
Methods:
Collection and Identification of Plant: The fresh leaves of B. pubescens, were obtained from Ogidi, Idemili North Local Government Area of Anambra state, Nigeria and identified by Mr Ozioko, a Taxonomist with the Biosource Development and Conservation Program (BDCP), Nsukka, Enugu State, Nigeria. The plants were then authenticated and kept in the herbarium with voucher number, B. pubescens (PCG 474/A/056). The leaves were air-dried for 2 weeks in the Pharmacognosy laboratory and milled, for use.
Toxicity Studies of the Methanol Extract of the Leaves of B. pubescence:
Acute Toxicity Study: Evaluation of the median lethal dose (LD50) and chronic toxicity of the methanol extracts of the leaves of B. pubescens were carried out in the Department of Physiology, Faculty of Basic Medical Science, Nnamdi Azikiwe University, Okofia, Nnewi Campus. This was determined using the method of Lorke (1983) 14. In this study, a total of 13 mice were used. They received the extract via oral route, and it was carried out in two phases.
Phase I: Nine (9) rats were used, and they were grouped into three groups of three mice each.
Group 1 received 10 mg/Kg; Group 2 received 100 mg/Kg; and Group 3 received 1000 mg/Kg. The animals were observed over a period of 24 h for mortality and there was none. The animals without obvious toxicity signs were progressed to the second phase. In this phase, 4 mice were used, and they were grouped into four groups of one animal each per group.
Phase II: Group 1 received 1200 mg/Kg, Group 2 received 1600 mg/Kg, Group 3 received 2900 mg/Kg, and Group 4 received 5000 mg/Kg. The animals were monitored over a period of another 24hrs for mortality.
LD50= √ a x b
Where a= maximum dose with 0% mortality; b= minimum dosed with 100% mortality
The LD50 of methanol extract of B. pubescensewas above 5000 mg/Kg.
TABLE 1: ACUTE TOXICITY STUDY
| Phase | Dose | Death | Observation |
| 1 | 10 mg/Kg
100 mg/Kg 1000 mg/Kg |
0/3
0/3 0/3 |
----------------------------
---------------------------- ……………………….. |
| 2 | 1200 mg/Kg
1600 mg/Kg 2900 mg/Kg 5000 mg/Kg |
0/1
0/1 0/1 0/1 |
The animal was calm
The animal was calm The animal was calm The animal was calm |
Chronic Toxicity Studies:
Experimental design and Sample Collection: Sixty male Wistar Rats weighing between 150-250 g were used for this study. The animals were acclimatized for a period of two weeks, and then randomly assigned into 4 groups of 15 animals each. Group 1 served as control (animals received only distilled water and laboratory chow); Group 2 received 250mg/Kg of the methanol extract of B. pubescens; Group 3 received 500mg/Kg of the methanol extract of B. pubescens; and Group 4 received 1000mg/Kg of the methanol extract of B. pubescens.
The administration of the extract was between 8 to10 am daily for a period of 16 weeks. The animals were sacrificed after the 16th week and their blood collected for liver and kidney function tests, and also for haematological tests.
Sample Collection: The livers and kidneys of the test animals were harvested and stored in 10% formalin as a preservative in a container before taking to histopathologist for histopathological investigations.
Estimation of Haematological Indicies:
Total White Blood Count: The total white blood cells (WBCs) were enumerated by the method of Robert (1993) 16. Blood was drawn exactly to the 0.5 mark in a white blood cell diluting pipette. Immediately, diluting fluid (glacial acetic acid – 2 cc, gentian violet – 0.025 g, distilled water made up to l00mL) was also drawn to the 11 marks. The content of the pipette was mixed for 3-5 min, and a drop was placed at the junction of the cover glass and the Neubauer counting chamber. The white cells were counted in the four large corner squares containing sixteen smaller secondary squares, each with an area of 0.04 mm2.
WBC per cu mm = Number of WBC X dilution (20) / Volume (0.4)
Estimation of Hemoglobin: Hemoglobin was determined by the method of Robert (1993) 16. Five mL of buffered cyanide/ferricyanide reagent was pipetted into clean and dry test tubes; 0.02 mL of blood was added to the same tubes. The pipette was thoroughly flushed with reagent. The solution was mixed well and incubated at 30°C. Absorbance A of sample was read against distilled water after 3 min at 546 nm. The concentration ‘C’ of hemoglobin was calculated as follows.
C = 36.77 × A (g/100 mL)
Estimation of Packed Cell Volume: Pack cell volume (PCV) was determined by the method established by Robert (1993) 17. The capillary tube was filled up to two-thirds (2/3) to three-quarters (3/4) full with well-mixed oxalated venous blood. One end of the tube was sealed with plasticine, and the filled tube was placed in the micro-hematocrit centrifuge, with the plugged end away from the center of the centrifuge. This was then centrifuged at a preset speed of 10000 to 12000 rpm for 5 min lastly, the spine tube was placed in the micro-hematocrit reader and the value taken.
Estimation of Red Blood Cells: Red blood cells were determined by the method established by Robert (1993) 17. Cardiac puncture blood was drawn from the rats and put in a RBC pipette up to 0.5 mark. RBC diluting fluid was taken up to 101 mark in single mark pipette or RBC pipette and rotated equally to mix the solution well by swirling. The haemocytometer was placed on the flat surface of the work bench and the cover slip was placed on the counting chamber and a small drop of diluted blood, hanging from the pipette, was allowed to sweep into the counting chamber by capillary action. Precaution was taken to make sure that there was no air bubble and there was no overfilling beyond the ruled area. The counting chamber was left on the bench for 3 min to allow the cells to settle. The cells were observed by placing the counting chamber on the mechanical stage of the microscope. Focused on the center room of the chamber, the cells were counted from the upper left corner of the room.
Data Analysis:
No. of cells x Dilution factor x Depth factor x Total ruled area / Area count
Where, Dilution factor = 200, Depth factor = 10, Total ruled area = 25, Area count = 5
Kidney Function Tests:
Creatinine Estimation: This test was carried out according to standard method (Bancroft and Gamble 2002 8; Thavarajah et al., 2012 18; Alturkistani et al., 2016) 2. Creatinine present in the serum or plasma reacts with alkaline picrate resulting in the formation of a yellow-red color. The intensity of the colour determines the concentration of creatinine in the sample. The absorbance of the yellow-red colour produced was measured using a spectrophotometer measured at 520 nm wavelength. Protein interference is eliminated using sodium laurylsulphate. A second absorbance reading after acidifying with 30% acetic acid corrects for non-specific chromogens in the samples.
Urea Estimation: This test was carried out according to standard method (Bancroft and Gamble, 2002 8; Thavarajah et al., 2012 18; Alturkistani et al., 2016) 2. Urea in serum is hydrolyzed to ammonia in the presence of the urease. The ammonia reacts with phenol and hypochlorite in alkaline medium to form indophenol. The intensity of the colour indicates the concentration of urea in the sample. Nitroprusside is used to catalyze the reaction. This indophenol is then measured photo metrically at 530-570nm wavelength.
Liver Function Tests:
Alkaline Phosphatase (ALP) Estimation: This test was carried out according to the method described by Wisse et al 2010 19. Alkaline phosphatase in alkaline medium hydrolyses phenyl phosphatase in 15min at 37°C and pH of 10 to release phenol which in the presence of potassium ferricyanide reacts with 4-aminophenazone to give a red-pink colour which is measured spectrophotometrically at 510nm wavelength. The intensity of the colour indicates ALP activity in the sample (Baird 2013).
Aspartate Amino Transferase (AST) Estimation: This test was carried out according to the method described by Reitman and Frankel (1957 15, Bartels 1973) 9. The substrates in the reaction are alpha ketoglutaric acid and L- Aspartate. The products formed by enzyme action are glutamate and oxaloacetate. Addition of 2, 4 dinitrophenyl hydrazine results in the formation of hydrazine complex with ketoacids. A red colour is produced on the addition of sodium hydroxide. The intensity of colour is related to the enzymatic activity and this can be measured at 550 nm wavelength using spectrophotometer.
Alanine Amino Transferase (ALT) Estimation: This test was carried out according to the method described by Reitman and Frankel (1957 15, Wisse et al 2010) 19. The substrates in the reaction are alpha ketoglutaric acid and L-aspartate. The products formed by enzyme action are glutamate and pyruvate. Addition of 2, 4 dinitrophenyl hydrazine results in the formation of hydrazine complex with ketoacids. A red colour is produced on the addition of sodium hydroxide. The intensity of colour is related to the enzymatic activity and this can be measured at 550 nm wavelength using spectrophotometer.
Tissue Processing for Photomicrography: Tissue sections were produced by normal histochemical methods of fixation, dehydration, clearing, impregnation, embedding, sectioning, mounting, and staining. The micrographs of relevant stained sections were subsequently taken with a photomicroscope.
Fixation: After weighing the organs, a small part was cut from each of them and immediately fixed in 10% formal saline in order to preserve the various constituents of the cells in their normal micro anatomical position and to prevent autolysis and putrefaction.
Fixation is a very important step in tissue processing as it does not only protect the tissue from autolysis and putrefaction but also hardens the tissue to withstand other chemicals applied in subsequent treatments and for easy handling.
Dehydration: After fixation, the tissues were transferred and dehydrated in ascending grades of alcohol (50%, 70%, 90%, 95% and 100% or absolute alcohol once for 2 h each but twice in absolute alcohol). The tissues were placed in ascending grades of alcohol to prevent distortion and distortion to the cell structure would happen if directly placed in absolute alcohol. However, sufficient time was allowed in absolute alcohol to enable complete dehydration (Kim et al., 2017 12; Dapson et al., 2010) 10.
Clearing: The tissues were cleared twice in xylene for 1 to 2 h each time. This is to avoid over exposure in the clearing agent, which will make them brittle. Xylene was used as the clearing agent as it does not only remove alcohol but is equally miscible with paraffin used in embedding.
Impregnation: The tissues were placed in molten paraffin wax at a constant temperature of 56οC (3οC above the melting point of paraffin wax used) in an oven and were passed through two changes of paraffin wax in the oven, 4 h each. This was done to replace the clearing agent or antemedium with molten paraffin wax and can also be referred to as infiltration. The tissues were subsequently removed from the oven and embedded in paraffin wax (Albert et al 2002 3; Wisse et al 2010) 19.
Embedding: Embedding is a process of burying a tissue in molten paraffin wax. The paraffin becomes a solid firm structure when it is cold, and this forms a support medium for the tissue during microtomy.
The tissues were then immersed in molten paraffin wax at a constant temperature of 36οC to 60οC in an oven of paraffin bath changing it twice for 2-4 h each time. They were left to cool and solidify in metallic embedding moulds. The tissue blocks obtained were casted onto the wooden blocks for sectioning (Alturkistani et al., 2016) 2.
Sectioning: This was done using a Rotatory Microtome. The tissue blocks were mounted on wooden blocks. With the microtome knife and blocks positioned accurately, sections were made at 5 microns each.
The ribbons of sections were floated in warm water bath (37οC) to straighten them. The best ribbons were picked with forceps and placed on albuminised slides. The slides were labelled using diamond pencils and transferred to a slide rack. They were then placed in an oven to keep the specimens warm before staining.
Staining: The tissues were stained using Ehrlich’s Haematoxylin and Eosin stains. The staining procedure is as follows: The slides treated with paraffin wax were cleared in xylene for 3 min, and were rehydrated in descending grades of alcohol, i.e. absolute alcohol for 2 min to remove xylene, 90% alcohol for 2 min, 70% alcohol for 2 min, 30% alcohol for 2 min, and then rinse in water for 1 min. The tissues were stained by immersing them in aqueous solution of haematoxylin for 30 min, and then rinsed in water to remove excessive stains. The tissues were subsequently differentiated in 1% acid alcohol for 1 min. This process called Bluing gave the tissues their characteristic blue background.
The tissues were then stained in aqueous eosin for 10 min. The tissues were now immersed in ascending grades of alcohol as follows; 50%, 70%, 90% and absolute alcohol for I min each and then cleared in xylene for 1 min. Staining gives contrasting colours to different elements of the cells or tissue thus making them conspicuous and easy to study.
Mounting: The slides were removed from the rack through their edges with the aid of forceps and placed on filter papers. Blotting was done in one direction on the filter papers using the index finger and a few drops of xylene were placed on the slides to make them wet.
A drop of Dibuty Phthalate Xylene (DPX) mountant was placed on the slide which was laid in the middle to minimize the likelihood of trapping air bubbles. The slides were quickly inverted over cover slip and then brought down horizontally until the mountant made contact.
Statistical Analysis: Data were analyzed using Statistical Package for Social Sciences (SPSS Version 23). The results were expressed as mean ± SEM.
Data for hematological parameters, kidney function test (creatinine and urea), liver function tests (ALT, AST and ALP) were analyzed using One-way ANOVA, followed by post hoc Least Significant Difference (LSD). While body weight was analyzed using Student dependent T-test. Values were considered significant at P<0.05.
RESULTS:
Acute Toxicity Test on the Plant: The results of the acute toxicity test on the plant are presented in Table 2. The methanol extract caused no death after the second stage of acute toxicity test carried out using Lorke method (Lorke, 1983). The LD50 was therefore estimated to be greater than 5000 mg/Kg and considered safe for acute administration of all the plants tested.
TABLE 2: RESULT OF ACUTE TOXICITY TEST ON THE PLANT
| Phase | Concentration (mg/kg) | Observation |
| 1 | 10
100 1000 |
0/3 - no death
0/3 - no death 0/3 - no death |
| 2 | 1600
2900 5000 |
0/1 - no death
0/1 - no death 0/1 - no death |
| Control | DMSO: Water ratio (1:1)
1 mL/kg |
0/1 - no death |
Chronic Toxicity Studies of Methanol Extract of B. pubescens:
Liver Enzymes (ALT, AST and ALP): Results of the chronic toxicity study on the methanol extract of B. pubescens are presented in Fig. 1, showing effects of the plant on liver enzymes ALT, AST and ALP levels. All data were analyzed using One-way Anova, followed by multiple comparism using Bonferroni, and data were considered significant at p<0.05. *p<0.05 shows that it was significant, and **P<0.05 shows that it was more significant.
Result from Fig. 1 showed that for ALT, there was a significant increase in group 2 (92.50±3.22), 3 (119.00±1.95), and 4 (121.00±2.10) when compared to group 1 (41.25±2.92). For AST, there was a significant increase in group 2 (79.50±6.60), 3 (135.00±5.40), and 4 (233.75±11.43) when compared to group 1 (28.00±1.47). For ALP, there was a significant increase in group 2 (95.00±9.12), 3 (151.50±6.30), and 4 (242.75±10.60) when compared to group 1 (54.25±1.79).
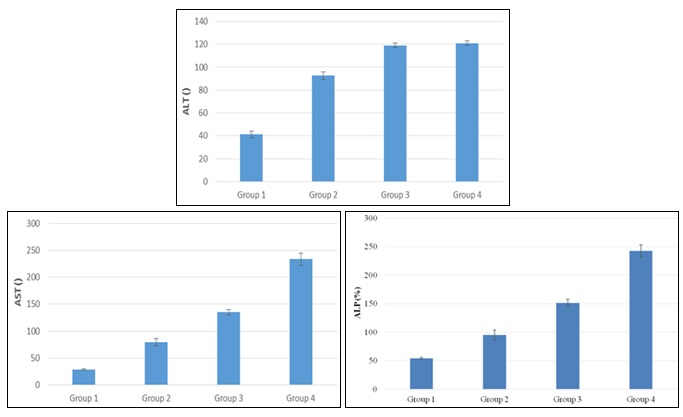
FIG. 1: THE EFFECT OF METHANOL EXTRACT OF B. PUBESCENS ON ALT, AST AND ALP LEVELS
Kidney Markers (Urea and Creatinine): Toxicity of the plant on the kidney was also studied. The effect of the plant on urea and creatinine levels is presented in Fig. 2. All data were analyzed using one-way Anova, followed by multiple comparism using Bonferroni, and data were considered significant at p<0.05. *p<0.05 shows that it was significant, and **p<0.05 shows that it was more significant. Result from Fig. 2 showed that there was an increase in urea level when comparing group 1 (44.8±1.73) to group 2 (82.25±5.85), group 3 (132.50±3.22), and group 4 (215.00±1.90), but the increase was significant. For creatinine level, there was an increase when comparing group 1(54.00±3.18) to group 2 (100.00±7.35), group 3 (138.75±5.54), and group 4 (228.75±13.28), but the increase was significant.
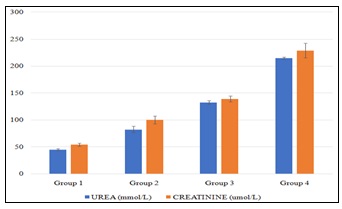
FIG. 2: THE EFFECT OF METHANOL EXTRACT OF B. PUBESCENS ON UREA AND CREATININE LEVEL
Hematological Parameters (RBCs, Hemoglobin, Packed Cell Volume, WBCs and Platelets: Effect of the plant on hematological parameters such as the red blood cells, hemoglobin, packed cell volume, white blood cells and platelets were studied, and results are presented in Fig. 3-4. All data were analyzed using One-way Anova, followed by multiple comparism using Bonferroni, and data were considered significant at p<0.05. *p<0.05 shows that it was significant, and **p<0.05 shows that it was more significant. From Fig. 3, it can be seen that there was an increase in RBC level in group 2 (5.05±0.11), 3 (5.00±0.04), and 4 (6.75±0.10) when compared to group 1 (4.74±0.09), but the increase was only significant in group 4 while that of group 2 and 3 was not significant. For hemoglobin level Fig. 5, there was an increase in group 2 (12.00±0.40), 3 (13.50±0.64), and 4 (15.50±0.65) when compared to group 1 (11.00±0.40), but the increase was only significant in group 3 and 4 while that of group 2 was not significant.
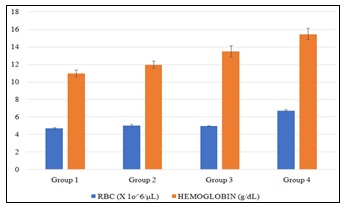
FIG. 3: THE EFFECT METHANOL EXTRACT OF B PUBESCENS ON RBC AND HEMOGLOBIN LEVEL
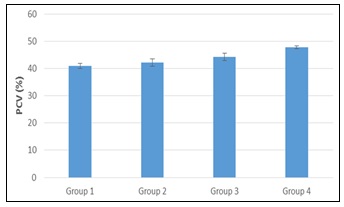
FIG. 4: THE EFFECT OF METHANOL EXTRACT OF B. PUBESCENS ON PCV LEVEL
For packed cell volume Fig. 4, there was an increase in group 2 (42.25±1.37), 3 (44.25±1.31), and 4 (47.75±0.47) when compared to group 1 (41.00±0.91), but the increase was only significant in group 4 while that of group 2 and 3 was not significant.
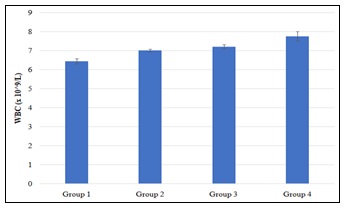
FIG. 5: THE EFFECT OF METHANOL EXTRACT OF B. PUBESCENS ON WBC LEVEL
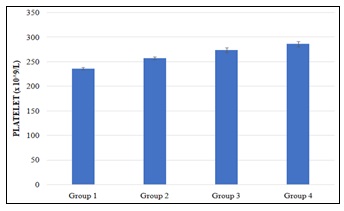
FIG. 6: EFFECT OF METHANOL EXTRACT OF B. PUBESCENS ON PLATELET COUNT LEVEL
Result from Fig. 5 shows that there was an increase in WBC level in group 2 (7.02±0.07), 3 (7.22±0.10), and 4 (7.77±0.26) when compared to group 1 (6.45±0.15), but the increase was significant in group 3 and 4 while that of group 2 was not significant. For platelet count Fig. 6, there was an increase in group 2 (257.50±3.22), 3(274.25±4.97), and 4 (286.25±5.54), when compared to group 1 (236.25±2.39), but the increase was significant across the treatment groups.
Body Weight: The effect of methanol extract of B. pubescens on Body weight is presented in Fig. 7. All data were analyzed using Student dependent T-test and data were considered significant at p<0.05. *p<0.05 shows that it was significant, and **p<0.05 shows that it was more significant.
Results presented in Fig. 7 show that there was an increase in the body weight in group 1 when comparing the initial weight (145.00 ±2.88) and final weight (195.00±13.22), but it was significant. For group 2, there was a significant increase in the body weight when comparing the Initial (170.00±4.08) and Final (227.50±11.08) body weight. For group 3, there was a significant increase in the body weight when comparing the Initial (165.00±6.45) and Final (212.50±6.29) body weight. For group 4, there was a significant increase in the body weight when comparing the Initial (177.50±4.78) and Final (235.00±6.45) body weight. (54.00 ±3.18) to group 2 (100.00±7.35), group 3 (138.75±5.54), and group 4 (228.75±13.28), but the increase was significant.
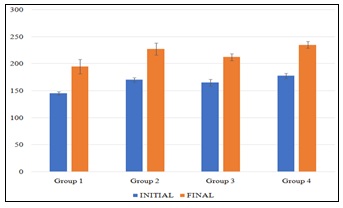
FIG. 7: THE EFFECT OF METHANOL EXTRACT OF B. PUBESCENS ON BODY WEIGH
Histopathological Findings: Photomicrographs showing the histology of the normal and treated cells of the kidney are presented in Fig. 8 (A-D).
In Fig. 8(A), the photomicrograph shows the normal histology of the kidney. The glomeruli were evenly distributed and of similar size, density of up to 32 per HPF with normal mesangial cellularity. There are numerous open glomerular capillaries, and normal endothelium. The tubules are of normal density and tubular epithelium is viable.
Fig. 8(B) is a photomicrograph showing the glomeruli of similar size, density of up to 30 per HPF with mild mesangial hypercellularity consisting of proliferating mesangial cells. There are few open glomerular capillaries, and normal endothelium. The tubules are of normal density and tubular epithelium is viable. The interstitium is thin and there is mild interstitial.
In Fig. 8(C), the photomicrographs indicates that the glomeruli are of mildly variable size, density of up to 33 per HPF with normal mesangial cellularity.
There are many open glomerular capillaries, and normal endothelium. The tubules are of normal density and tubular epithelium is viable. The interstitium is thin and there is mild interstitial.
In Fig. 8(D), the photomicrographs show the glomeruli are of similar size, density of up to 30 per HPF with mild mesangial hypercellularity consisting of proliferating mesangial cells.
There are few open glomerular capillaries, and normal endothelium. The tubules are of normal density and tubular epithelium is viable. The interstitium is thin and there is mild interstitial.
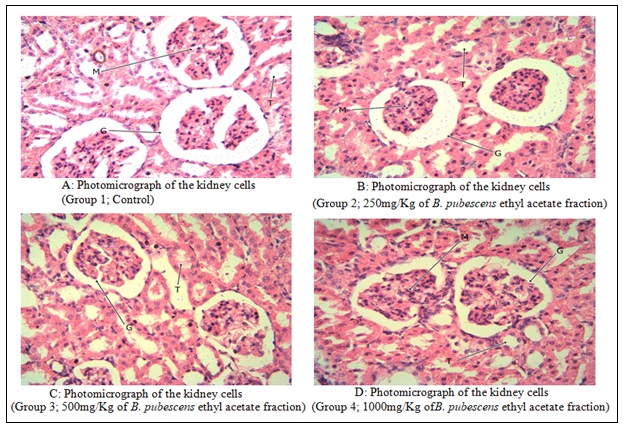
FIG. 8: PHOTOMICROGRAPHS SHOWING THE HISTOLOGY OF THE NORMAL AND TREATED CELLS OF THE KIDNEY. STAINED BY H&E TECHNIQUE. X400. WHERE G = GLOMERULI, M = MESANGIUM, T = TUBULE
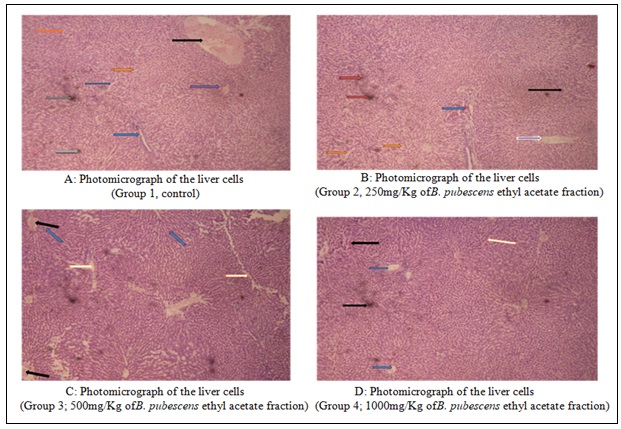
FIG. 9: PHOTOMICROGRAPHS SHOWING THE HISTOLOGY OF THE NORMAL AND TREATED CELLS OF THE LIVER. STAINED BY H & E (X 100)
Also, photomicrographs showing the histology of the normal and treated cells of the liver are presented in Fig. 9(A-D).
In Fig. 9(A), the photomicrograph shows a well-preserved liver architecture. The central lobular vein marked by (black arrow), portal triads evenly spaced marked by (yellow arrow), liver sinusoids (marked by blue arrows), hepatocytes cells (marked by green arrow), erythrocyte cells (marked by orange arrow) and nuclei (marked by grey arrows) with evidence of free anastomsing peri-portal limiting plates.
In Fig. 9(B), the central vein marked by (Yellow arrow) showed mild congested blood vessels, the portal triad marked by (Black arrow) shrinkage of cells, proliferation of liver cells with blood filled liver sinusoids (marked by blue arrow), Mild lobular inflammation marked by (Green arrows), Mild Necrosis marked by (Orange arrows). Fig. 9(C) displays a well-preserved liver architecture.
The portal is evenly spaced around the central vein marked by (Blue arrows), the central vein showing mild congested blood vessels marked by (Black Arrows), and Occasional lobular inflammation without confluent necrosis marked by (White arrows). In Fig. 9(D), the central vein with portal triads evenly spaced with mild peri-portal inflammation marked by (Blue arrows), Mild necrosis marked by (Black arrows), No lobular inflammation marked by (White arrows).
DISCUSSION AND CONCLUSION: Chronic toxicity studies on the ethyl acetate fraction of B. pubescens indicated that the plant is relatively safe at the therapeutic dose. The toxicity of the plant was shown to be dose dependent. The kidney and liver enzymes increased with increasing doses whereas the histopathological damage after long administration on these organs was mild.
ACKNOWLEDGEMENT: Nil
CONFLICT OF INTEREST: Nil
REFERENCES:
- Akande IS, Akande BE and Gbenle GO: Toxicology and antioxidant effects of Baphia nitida on diazepam induced oxidative stress in rats. AJBR 2011; 5(8): 255-263.
- Alturkistani HA, Tashkandi FM and Mohammedsaleh ZM: Histological stains: a literature review and case Study. Global Journal of Health Science 2016; 8(3): 72-79.
- Alberts B, Johnson A and Lewis J: Molecular Biology of the Cell. Garland Science, 4th Edition 2002.
- Alberts B, Johnson A and Lewis J: Molecular Biology of the Cell. Garland Science, 4th Edition 2002.
- Alberts B, Johnson A and Lewis J: Molecular Biology of the Cell. Garland Science, 4th Edition 2002.
- Alberts B, Johnson A and Lewis J: Molecular Biology of the Cell. Garland Science, 4th Edition 2002.
- Baird JK: Evidence and implications of mortality associated with acute Plasmodium vivax malaria. Clinical Microbiology Reviews 2013; 26(1): 36-57.
- Bancroft JD and Gamble M: Theory and Practice of Histological Techniques: Churchill Livingstone, Edinburgh 2002; 16-64.
- Bartels H and Bohmer M: A kinetic method for measurement of serum creatinine. Med Lab 1973; 26(9): 209-215.
- Dapson R, Horobin RW and Kiernan J: Hematoxylin shortages: their causes and duration and other dyes that can replace hemalumin routine hematoxylin and eosin staining. Biological Stain Commission, Biotechnic and Histochemistry 2010; 85(1): 55-63
- FAO: Some medicinal forest plants of Africa and Latin America, Journal of Science 1996; 67: 75-78: 161-162.
- Kim S, Kim J, Okajima J and Cho N: Mechanical Properties of Paraformaldehyde-Treated Individual Cells Investigated By Atomic Force Microscopy and Scanning Ion Conductance Microscopy; Nano Convergence, Korean NanoTechnology Research Society 2017; 4: 5.
- Kumar KT, Gorain B, Roy DK, Zothanpuia Z, Samanta SK, Pal M, Biswas P, Roy A, Adihikari D, Karmakar S and Sen T: Anti-inflammatory activity of Acanthus ilicifolius. Journal of Ethnopharmacology 2008; 120: 7-12.
- Lork D: A new approach to practical acute toxicity testing. Arch. Toxical 1983; 53: 275-289.
- Reitman S and Frankel S: A colorimetric method for the determination of serum glutamic oxaloacetic and glutamic pyruvic transaminases. AJCP 1957; 28: 56-63.
- Robert SF: The measurement and importance of red cell survival. Am J Hematol 1993; 84: 109-114.
- Robert SF: The measurement and importance of red cell survival. Am J Hematol 1993; 84: 109-114.
- Thavarajah R, Mudimbaimannar VK, Elizabeth J, Rao UK and Ranganathan K: Chemical and physical basis of routine formaldehyde fixation. JOMP 2012; 16(3): 400-05.
- Wisse E, Braet F, Duimel H, Vreuls C, Koek G, Damink S, Maartje V, Geest B, Dejong C, Tateno C and Frederik P: Fixation Methods For Electron Microscopy For Human and Other Liver. World Journal of Gastroenterology 2010; 16(23): 2851-2866.
This Journal licensed under a Creative Commons Attribution-Non-commercial-Share Alike 3.0 Unported License.
Article Information
4
200-209
1914 KB
800
English
IJP
Anowi Chinedu Fredrick *, Ezea Charity Chinasa and C. C. A. Azikiwe
Department of Pharmacognosy and Traditional Medicine, Nnamdi Azikiwe University Awka, Nigeria.
cf.anowi@unizik.edu.ng
10 May 2024
26 May 2024
29 May 2024
10.13040/IJPSR.0975-8232.IJP.11(5).200-09
31 May 2024