


THE STUDY OF POLYPHENOLIC COMPOUNDS PROFILE AND ANTIOXIDANT ACTIVITY OF VITIS VINIFERA L. LEAVES FROM WESTERN REGIONS OF ALGERIA
HTML Full TextTHE STUDY OF POLYPHENOLIC COMPOUNDS PROFILE AND ANTIOXIDANT ACTIVITY OF VITIS VINIFERA L. LEAVES FROM WESTERN REGIONS OF ALGERIA
M. A. Selka * 1, 2, M. Y. Achouri 1, 2, A. Chenafa 1, 2 and H. Toumi 2
Pharmacognosy Laboratory 1, Department of Pharmacy, University of Sidi Bel Abbes, Boulevard Colonel Othman, Sidi Bel Abbes, Algeria.
LRDP 2, University of Oran, Es Senia, Oran, Algeria.
ABSTRACT: Polyphenols are secondary metabolites found in all vascular plants. Red grapes are one of these plants rich in these substances. The main objective of this study was to trace the polyphenolic compounds profile of red grape leaves from various Western regions of Algeria and to study their antioxidant activity. A spectrophotometric assay of the main phenolic groups and a chromatographic assay by HPLC-DAD and HPLC-FLU were carried out. The screening of anti-oxidant power was also performed by phosphomolybdenum method and DPPH assay. The results showed that all the studied leaves samples are rich in phenolic compounds with differences from one region to another. Polyphenol contents varied from ± 246 ± 18.93 to 923 ± 88.06 mg Eq gallic acid/g.dw. The HPLC assay identified the polyphenolic compounds profile of the studied samples. The antioxidant activity was widely covered and highlighted; the leaves extract of Aïn Temouchent sample is the most active with an EC50 in the DPPH test of 0.08 mg/mL, which is higher than EC50 of ascorbic acid. This work helped to trace the polyphenolic compounds profile of Algerian red grape leaves and allowed to valorize this plant by highlighting their antioxidant properties.
| Keywords: |
Polyphenol, Antioxidant, Red Grape
INTRODUCTION: Plants are the inevitable source for the discovery of new important molecules in drug development. Today, several secondary metabolites derived from plants are currently used in modern medicine in several countries 1. Polyphenols are secondary metabolites found in all vascular plants and constitute a large family of ubiquitous and varied substances, ranging from simple molecules to complex structures.
Red grapes are one of its plants rich in these substances, this plant that comes from antiquity, makes it one of the most widely cultivated fruit crops in the whole world 2. Also, to the fruit "the grape," the leaves of Vitis vinifera were used in the past as a spasmolytic, hypoglycemic and vasorelaxant, as well as an antibacterial, antifungal and anti-inflammatory agent 3.
Most of the therapeutic properties of that plant and its leaves are attributed to phenolic compounds 4. The chemical nature and concentrations rang of these compounds depend on many factors: the stage of maturation, the soil, the climatic conditions, the cultivation of red grape and the treatment to which it is subjected 5. Algeria represents a great source of diversity of several Mediterranean species, including Vitis vinifera 6 and many chemotypes may be found. The objective of this work is to trace the polyphenolic compounds profile of the leaves of Vitis vinifera var. sativa from the Western region of Algeria and to highlight their anti-oxidant property and its variability according to the polyphenolic composition.
MATERIALS AND METHODS: The present study was carried out on the leaves of Vitis vinifera ssp. sativa of the cultivated compartment. The leaves were obtained from various regions of Algeria, the choice of regions was objectified by the international organization of oenology and viticulture report 7 classifying the most known regions for viticulture in Algeria. The geographical situations, as well as the bioclimatic stages of the different stations, are represented in Table 1.
The region of El-Bayadh does not appear on the report of the OIV; it was introduced due to the recent development of viticulture in these regions with their particular climate.
TABLE 1: GEOGRAPHICAL SITUATIONS AND BIOCLIMATIC STAGES OF THE DIFFERENT STATIONS OF THE STUDY
| Area | Harvest period | Latitude (North) | Longitude (West) | Altitude (M) | Bioclimatic stages |
| Terga-AïnTemouchent | October 2015 | 35.41’ | -1°17’ | 28 | Semi-aride |
| Bir El Djir-Oran | October 2015 | 35.72’ | -0°55’ | 164 | Sub-humid |
| Stidia-Mostaganem | October 2015 | 35.83’ | 0° 006’ | 26 | Sub-humid |
| El-Bayadh | October 2015 | 32.35’ | 0° 60’ | 810 | Saharian |
| Beni Chougrane-Mascara | October 2015 | 35.39’ | 0° 14.’ | 563 | Sub-humid to humid |
Extraction of Phenolic Compounds: 40 g of crushed leaves were placed in a balloon containing 100 ml of methanol-water (80-20) v/v and 0.1 ml/ml of concentrated hydrochloric acid to prevent polyphenol oxidation. The extraction was carried out by reflux at a temperature of 60 °C for 30 min. The extracts were filtered and centrifuged at 3000 rpm for 20 min at 25 °C then stored in the dark at 4°C 8.
Determination of Total Phenolic Content: The total polyphenol content was determined according to the method described by Ojeil et al., 400 microliters of the methanolic extract was mixed with 1.6 ml of sodium carbonate solution (Na2CO3) at 7.5%. 2 ml of Folin-Ciocalteu reagent (diluted at 1/10th) freshly prepared were added and then homogenized using a vortex. After 30 min of dark incubation; the absorbance was determined at 765 nm. A standard calibration curve was prepared using different concentrations of gallic acid in methanol. All operations were performed in triplicate. The results were expressed in milligram of gallic acid equivalent per g of crude extract (mg EQ GAE /mg.dw) 9.
Determination of Flavonoid Content: Total flavonoid content was estimated with a colorimetric test using aluminum trichloride AlCl3. 1 ml of diluted methanolic extract was mixed with 3 ml of distilled water, followed by 300 μl of sodium nitrite solution (NaNO2) at 7%. After five minutes of incubation, 300 μl of aluminum chloride (AlCl3) at 10% was added to the mix, after six minutes, 1 ml of sodium hydroxide (1M) was added to the tubes, and the whole mixture was shaken with a vortex. The absorbance was determined at 510 nm against methanol as a blank. A calibration curve using different concentrations of catechin in methanol was prepared. All the operations were carried out in triplicate. The results were expressed in milligram of catechin per g equivalent of dry weight (mg EQCE/g.dw) 10.
Determination of Condensed Tannin Content: The quantity of condensed tannin was estimated using the vanillin method 11. 50 μl of leaf extract was added to 1500 μl of vanillin/methanol solution (4%, m/v) then mixed with a vortex. 750 μl of concentrated hydrochloric acid (HCl) were added up, and the whole mixture was kept for 20 min at room temperature. The absorbance was determined at 550 nm compared to a blank. The results were expressed as milligrams of catechin per g of dry weight (mg EQ CE/g.dw) referring to the standard catechin curve.
Chromatographic Analysis by HPLC: HPLC analyses were performed on a Waters Acquity system including a vacuum degasser, a quaternary pump, a column oven, an autosampler and a PDA5P diode array detector with 5 cm flow cell. Separation was achieved by a reversed-phase Acquity UPLC HSS T3 column 1.8 µm.
The temperature of the column was maintained at 30 ° C.The mobile phase consisted of formic acid at 4% in water (mobile phase A) and the mixture acetonitrile- methanol-water 90:5:5 (mobile phase B) with a gradient elution system, as follows: 0-2 min 8% B, 2-20 min 8-16% B, 20-22 min 16-23% B, 22-23 min 23-40% B and 23-25 min back to 8% B with the initial conditions. The flow used is 1 ml/ min and the separation time was 25 min, with an injection volume of 10 µl. Free flavanols, catechin, epicatechin, and proanthocyanins B1 and B2 are excited at 280 nm, and the emission was measured at 310 nm. Trans-resveratrol is excited at 324 nm, and the emission was measured at 370 nm.
- For flavonols, the optical density was measured at 365 nm, and a spectrum was recorded in the range of 200-500 nm.
- For phenolic acids, a spectrum was recorded between 200 and 500 nm. The optical density was measured at 260 nm for protocatechuic acid, at 275 nm for gallic acid, and at 325 nm for caffeic and coumaric acids.
Preparation of the Extracts: Phenolic compounds extraction for the chromatographic analysis was carried out according to the protocol of Tabart et al., 12.
For Free Flavanols: 1 g of dried leaves were crushed in 10 ml of acetone. The mixture was stirred for 1 h at 70 °C and centrifuged at 17000 g for 15 min. The supernatant was collected, and the pellet was re-suspended in 10 ml of acetone. The supernatants were added and used for free flavanols (catechin, epicatechin,) and resveratrol analysis.
For the Flavonols: 1 g of dried leaves were crushed in 10 ml of acetone/water/acetic acid (98/20/2). The mixture was stirred for 1 h at 40 °C and centrifuged at 17000 rpm for 15 min. The supernatant was collected, and the pellet was re-suspended in 10 ml of solvent. The supernatants were added and used for flavonols (rutin, myricetin, quercetin, and kaempferol) analysis. For the aglycone analysis, prior hydrolysis is necessary. The extract was mixed with a 2.4M HCl solution in 50% of methanol containing 3 mg/mL of ascorbic acid (v/v) the mixture was kept at 80 °C for 60 min.
For Free Phenolic Acids: 1 g of dried leaves were crushed in 8 ml of 0.1N NaOH solution. The mixture was stirred for 2 h at 30 °C, and the pH level was reduced using HCl 3M. A di-ethyl ether extraction was carried out. The supernatant was collected, and the pellet was re-suspended in a solvent. The supernatants were added and evaporated before free phenolic acids analysis.
Preparation of Standards: Stock solutions of the different standards were prepared by dissolving 50 mg in HPLC grade methanol. Calibration curves were constructed in methanol by preparing serial dilutions from 0.195 to 100 μg/mL 17. All samples were extracted in duplicate and the assays performed in duplicate. The results were expressed in μg/g of dry matter with the mean, and standard deviation of the four performed measurements.
Anti-oxidant Activity Evaluation:
Total Anti-oxidant Capacity (TAC): Total antioxidant capacity (TAC) of the extracts was evaluated by the phosphomolybdenum method described by Prieto P et al. 13 0.3 ml of methanolic extract was mixed with 3 ml of phospho-molybdenum reagent solution (0.6 M sulfuric acid, 28 mM sodium phosphate and 4 mM ammonium molybdate). The tubes were screwed and incubated at 95 °C for 90 min. After cooling, the absorbance was measured at 695 nm against a blank prepared in the same manner. Ascorbic acid was used as a standard. A stock solution of ascorbic acid (5000 mg/L) was prepared in distilled water, from which dilutions were made ranging from 25 mg/L to 500 mg/L. All experiments were performed in triplicate. The results were expressed in milligram equivalent of ascorbic acid per g of dry weight (mg EAA/g MS).
Free Radical Scavenging Activity: 50 μl of different concentrations of each extract was added to 1.950 ml of DPPH• methanolic solution (0.025 g/l) freshly prepared. A negative control was obtained by mixing 50 μl of methanol with 1.95 ml of the DPPH• methanolic solution. After 30 min of dark incubation at room temperature, the absorbance was determined at 515 nm against methanol as a blank. Extract concentration providing 50% inhibition (EC50) was calculated using the graph by plotting inhibition percentage against extract concentration. Ascorbic acid (AA) was used as positive control, and all tests were carried on triplicates 14.
Statistical Analysis: All results were expressed as means with standard deviation (m ± SD) for (n) separate experiments. Analysis of variance test (ANOVA) was used to check the significance of differences observed simultaneously between total polyphenol, flavonoid and condensed tannin amounts. Tukey-Kramer, multiple comparison test, was used when the ANOVA P-value≤0.05 to detect significant statistical differences within groups. Pearson correlation test was used to find a correlation between the antioxidant activity in the DPPH test and total polyphenol, flavonoid, and condensed tannin contents.
RESULTS AND DISCUSSION: Total phenolic, flavonoid, and condensed tannin contents.
TABLE 2: TOTAL PHENOLIC, FLAVONOID AND CONDENSED TANNIN AMOUNTS OF GRAPE LEAVES
| Leaf samples | Total phenolic content* | Flavonoid content** | Condensed tannin content** |
| Oran | 923 ± 88.06a | 9.87 ± 0.15a | 5,14 ± 0.16a |
| Mascara | 491 ± 72.22b | 7.20 ± 0.14b | 4,19 ± 0.04b |
| Mostaganem | 299 ± 14.76b | 7.02 ± 0.04b | 5,00 ± 0.05a |
| El-Bayadh | 316 ± 13.85b | 5.74 ± 0.25b | 1,81 ± 0.04c |
| Aïn-Temouchent | 391 ± 40.42b | 10.62 ± 0.23a | 5,30 ±0.04a |
* mg of gallic acid equivalent per g dry weight, ** mg of catechin equivalent per g dry weight, Means ± SD, n=3. Means with different superscript letters in a column are significantly different (P<0.05) based on one way ANOVA test and Tukey Post Hoc test
Table 2 compares the results of polyphenol, flavonoid and condensed tannin contents for the different samples. We observed that the studied regions leaves contain more flavonoids than condensed tannins. A global comparison of polyphenol, flavonoid and condensed tannin contents indicated that a high level of flavonoid and condensed tannin do not necessarily correspond to a high level of total polyphenol; therefore, their distributions varied from one region to another.
The sample from the Oran region was the richest one in total polyphenol, and that of Ain-Temouchent region was the richest one in flavonoid and condensed tannin compared to the other regions samples. The mean of total polyphenol content in our work is in agreement with that reported by Yu et al., who found a mean of 328.5 ± 1.0 mg Eq in gallic acid/g.dw of polyphenol content for Vitis labruscana bailey leaves 15. Pastrana-Bonilla et al., were able to determine a polyphenol content with a mean of 351.6 mg Eq in gallic acid/g.dw, obtained from 10 cultivars of muscadine (Vitis rotundifolia) in southern Georgia, the United States, which correlates with the results of our study 16.
Other studies such as that of Güler et al., who worked on five leaf samples from the region of Manisa in Turkey reported lower contents than those found in our work with a mean of 14.256 mg Eq of gallic acid/g.dw 17. The work of Taware et al., also showed very low polyphenol levels, obtained from an extract of five red grape leaf samples from India, the mean of these levels did not exceed 5 mg Eq of gallic acid/g.dw 18. Flavonoid contents also varied from one region to another, the results obtained in our work are close to those of Güler et al., who found total flavonoid amounts varying from 5.08 to 7.22 Eq mg of catechin/g.dw 17. View the lack of studies on condensed tannins red grape leaves; the comparison was not possible with the literature.
According to El-Babili et al., tea leaves which are known for their richness in phenolic compounds contains 874.10 ± 3.50 mg Eq gallic acid/g.dw of polyphenols, and 11.30 ± 0.17 mg Eq of catechin/ g.dw of condensed tannins, which is close to the levels found in our work 19. Our results about polyphenolic levels are in agreement with some studies but not with others. This variability is probably due to the genotypic factors 20, to the biotic conditions (species, organ, and physiological stage), to the abiotic conditions (edaphic factors) 21, the nature of the soil, the type of the microclimate and the bioclimatic floors where these plants grow 5. These same factors may also explain the level variations in our study from one region to another, since some regions have a special climate, which inevitably affects the composition of the soil especially hydric stress, which is one of the factors that can significantly influence the polyphenolic composition as reported in the study of Król et al. 22
HPLC Analysis: All extracts were analysed by HPLC-DAD to quantify different phenolic groups: phenolic acids (Gallic AC, Protocatechuic AC, p-Coumaric AC, Caffeic AC), flavonol aglycones and their glycosides (Quercetin, kaempferol, myricetin, rutin) as well as monomeric and dimericflavonoids (catechin, epicatechin, proanthocyanins B2) and stilbenes (Trans-resveratrol). Fig. 1 and 2 show Mostaganem leaf extract chromatogram with detection of monomeric and dimericflavanols and trans-resveratrol.

TABLE 3: FLAVANOL AND TRANS RESVERATROL AMOUNTS OF GRAPE LEAF EXTRACT OBTAINED BY HPLC-DAD-FLUO
| Catechin* | Epicatechine* | Proanthocyanin B2* | Trans-resveratrol* | |
| Oran | 2.32 ± 1.34 | 3.29 ± 0.31 | 0 | 13.47 ± 0.37 |
| Ain Temouchent | 32.33 ± 1.42 | 7.59 ± 0.58 | 2.014 ± 0.316 | 40.24 ± 3.18 |
| Mostaganem | 65.25 ± 3.99 | 64.93 ± 2.91 | 16.184 ± 1.559 | 33.23 ± 2.47 |
| Mascara | 30.64 ± 3.59 | 9.99 ± 1.47 | 0 | 63.51 ± 3.08 |
| El-Bayad | 23.87 ± 2.35 | 14.47 ± 2.09 | 0 | 65.28 ± 2.16 |
*µg per g dry weight, Means ± SD, n=4
The result of flavanol and trans-resveratrol quantification by HPLC analysis is represented in Table 3. Mostaganem samples contained the highest amounts of catechin and epicatechin (65.25 ± 3.99 µg/g.dw and 64.93 ± 2.91 µg/g.dw respectively), these levels were substantially identical. For Ain-Temouchent and Mascara samples, their catechin levels were very similar but two times less than Mostaganem sample amounts.
The proanthocyanidin B2 were absent in Oran, Mascara, and El-Bayad samples. Their amounts were maximal in Mostaganem samples with a value of 16.184 ± 1.559 µg/g.dw. Regarding trans-resveratrol, the highest levels were found in Mascara and El-Bayad samples (65.28 ± 2.16 µg/g.dw and 63.51 ± 3.08 µg/g.dw). Regarding proanthocyanidin B1, they were absent in all the samples.
Phenolic Acids: Fig. 3 and 4 represent the chromatogram of Mostaganem extract with detection of phenolic acids. The result of phenolic acid quantification by HPLC analysis is represented in Table 4. Protocatechuic acid and P-coumaric acid were present in all the samples, unlike gallic acid and caffeic acid which were found just in few ones.
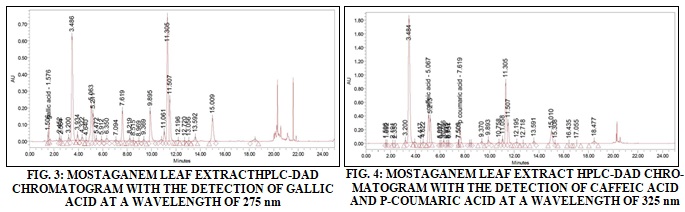
TABLE 4: PHENOLIC ACIDS AMOUNTS OF GRAPE LEAF EXTRACTS OBTAINED BY HPLC-DAD
| Procatechuic acid | P-coumaric acid | Gallic acid | Caffeic acid | |
| Oran | 2.45 ± 0.21 | 8.34 ± 0.16 | 3.89 ± 0.44 | 0 |
| Ain Temouchent | 8.32 ± 0.27 | 13.31 ± 0.72 | 0.83 ± 0.06 | 0 |
| Mostaganem | 14.18 ± 0.42 | 69.73 ± 1.22 | 31.89 ± 2.08 | 112.01 ± 13.39 |
| Mascara | 37.36 ± 1.04 | 9.44 ± 0.08 | 0 | 0 |
| El-Bayad | 28.17 ± 0.86 | 8.99 ± 0.37 | 0 | 0 |
* µg per g dry weight, Means ± SD, n=4
Flavonol Aglycones and Glycosides: Fig. 5 and 6 represent the chromatogram of Mostaganem leaf extract with detection of flavonols before and after hydrolysis. The result of flavonol glycosides and aglycones quantification by HPLC analysis is represented in Table 5.
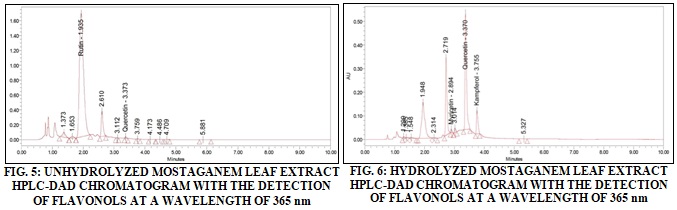
TABLE 5: FLAVONOL GLYCOSIDE AND AGLYCONE AMOUNTS OF GRAPE LEAF EXTRACTS OBTAINED BY HPLC-DAD
| Rutin | Myricetin
aglycone |
Myricetin
glycoside |
Quercetin
aglycone |
Quercetin
glycoside |
Kaempferol
aglycone |
Kaempferol
glycoside |
|
| Oran | 1652 ± 39 | 0 | 34.97 ± 4.47 | 3.21 ± 0.37 | 1324 ± 73 | 0 | 247.8 ± 17.8 |
| Ain-Temouchent | 1854 ± 21 | 0 | 22.61 ± 1.62 | 9.26 ± 0.78 | 1674 ± 9 | 0 | 518.8 ± 9.3 |
| Mostaganem | 3339 ± 31 | 0 | 78.91 ± 2.84 | 16.97 ± 1.40 | 2736 ± 337 | 0 | 533.8 ± 32.1 |
| Mascara | 3124 ± 33 | 0 | 4.60 ± 1.27 | 12.20 ± 1.03 | 3686 ± 172 | 0 | 975.0 ± 34.2 |
| El-Bayad | 3063 ± 18 | 0 | 45.29 ± 5.87 | 8.56 ± 1.41 | 3397 ± 316 | 0 | 972.7 ± 115.9 |
| Oran | 1652 ± 39 | 0 | 34.97 ± 4.47 | 3.21 ± 0.37 | 1324 ± 73 | 0 | 247.8 ± 17.8 |
* µg per g dry weight, Means ± SD, n=4
Among the studied flavonols, only quercetin was found in free forms in all leaf extracts. This aglycone form was found with very low levels compared to the combined one. The highest levels of quercetin glycoside were found in Mascara and El-Bayad samples, these are about 3686 ± 172 µg/g.dw and 3686 ± 172 µg/g.dw respectively.
Myricetin was only detected as a conjugated form, the most important amount was found in Mostaganem leaf samples at the order of 78.91 ± 2.84 µg/g.dw. Kaempferol amounts were higher than the ones of myricetin. Mascara and Mostaganem leaf samples contained the highest levels (975.0 ± 34.2 µg/g of dw and 533.8 ± 32.1 µg/g.dw respectively). Rutin was detected with high levels in all the extracts. Mostaganem samples were the richest one (3339 ± 31 µg/g.dw).
This chromatographic analysis helped to identify 12 different polyphenolic compounds compared to five in the study of Güler et al., and 11 in the one of Katalinic et al. 17, 23 The same number of compounds was found in the study of El-Khateeb et al. 24 In the studies cited above only gallic acid and caffeic acid were found as phenolic acids. The levels of gallic acid found in our study corroborate those found in the study of Güler et al., 17 who obtained a mean of 6.22 µg/g.dw for five studied samples. In the study of Pastrana-Bonilla et al., 16 the mean of gallic acid amounts quantified by HPLC DAD for 10 samples was 8.57 µg/g which is similar to our results. The results of Schneider et al., study 25 are also comparable with those of our study regarding gallic acid with a mean of 6.4 µg/g. The mean of caffeic acid amounts in our study is slightly lower than those of Güler et al., (44.87 µg/g) 17 but remains higher than those of Schneider et al., (16.2 µg/g) 25. However, it is important to note that in our study, some samples had undetectable levels of caffeic acid which is in contradiction with all the referenced studies.
The presence of P-coumaric acid was also reported by Schneider et al., 25 with a mean of 27 µg/g, which is slightly inferior to our results. Protocatechuic acid was detected in our samples, which was reported only in the work of El-Khateeb et al., and the study of Teixeira et al., 24, 26 who noted its presence in grape seeds and the skin of the fruit but not in the leaves. Regarding flavanol monomers, the mean of catechin amounts found in our work is much lower than that found in the study of Güler et al., 17 which was at the order of 107.926 µg/g and lower than that found in the study of Schneider et al., which was at the order of 323 µg/g 25. The same observation is to be highlighted regarding the mean of epicatechin amounts which remains significantly lower than that found in the studies cited above, however Katalinic et al., 23 found the mean of epicatechin amounts of the order of 17.4 µg/g, which is similar to our results.
For proanthocyanidins B2, the majority of studies (Monagas et al., El-Khateeb et al., Teixeira et al.,) did not report their presence in the leaves, but they found the min grape seeds and in the pulp 24, 26, 27. Trans-resveratrol was the only studied stilbene in our work. Appreciable quantities were found with a mean of 32.22 µg/g. This value exceeds that found by Katalinic et al., (8.9 µg/g) and that found by Babikova et al., study (11.90 µg/g) 23, 28. Several studies showed that Vitis vinifera produces stilbenes especially trans-resveratrol in response to some physiological stressors including ozone and UV-C radiations 26, 29.
These factors can multiply trans-resveratrol levels more than 100 times in the leaves and the skinned fruit. Consequently, it may be possible to modify stilbene contents in Vitis vinifera L. by industrial processes to increase their amount. Concerning the flavonol group, conjugated forms are widely present with quercetin as the most abundant, followed by kaempferol and myricetin. This distribution is in accordance with that found in the work of Katalinić et al., (2009) but with mainly higher values especially for quercetin 30. For flavonol free forms, only quercetin aglycone was detected in our study, unlike to Monagas et al., research 27 and Fernandes et al., work 3 where kaempferol aglycone was detected in the first study and myricetin aglycone, in the second one.
The presence of rutin at significant levels is in agreement with the results of Monagas et al., and Fernandes et al., studies, who agree on the fact that it is a common flavonol found in red grapes 27, 3. According to Mattivi et al., and Jeffery et al., the presence or the absence of these two flavonol glycosides are due to an enzyme, flavonoid-3', 5’ hydroxylase which is characteristic of red Vitis vinifera L. varieties 31, 32.
Anti-oxidant Activity:
Total Anti-oxidant Capacity (CAT): The Fig. 7 summarizes the total antioxidant capacity of red grape leaf extracts of the studied regions. Total antioxidant capacity values were relatively high with that of Oran samples as the most important one (18.128 ± 0.157 mg Eq ascorbic acid /g.dw).
DPPH Radical Scavenging Capacity: Fig. 8 shows the DPPH radical scavenging activity of the different extracts which is expressed in terms of EC50 value concerning ascorbic acid as standard.

The EC50 value is inversely proportional to the antioxidant activity, ascorbic acid which was used as a standard has a powerful radical scavenging activity with EC50 of the order of 0.15 mg/mL. All the extracts have concentration-dependent anti-oxidant activity, the most important one is found with Aïn-Temouchent leaf extract with EC50 of the order of 0.08 mg/mL which is twofold higher than that of ascorbic acid.
The anti-radical power (ARP) can be classified as follows, from the more important to the less important: E Aïn-Temouchent >ascorbic acid>E Mostaganem>E Mascara> E Oran> E El-Bayadh. This result is close to that reported by Fernandes et al., where the lowest EC50 found among 20 samples of various varieties of red grape leaves from Portugal was 0.06 mg/mL 3.
The Correlation between Free Radical Scavenging Activity with Total Phenolic, Flavonoid, and Condensed Tannin Contents: To establish the relationship between the anti-radical activity and total polyphenol, flavonoid and condensed tannin content, the Fig. 9 illustrates the variation of EC50 depending on the amount of the phenolic groups.
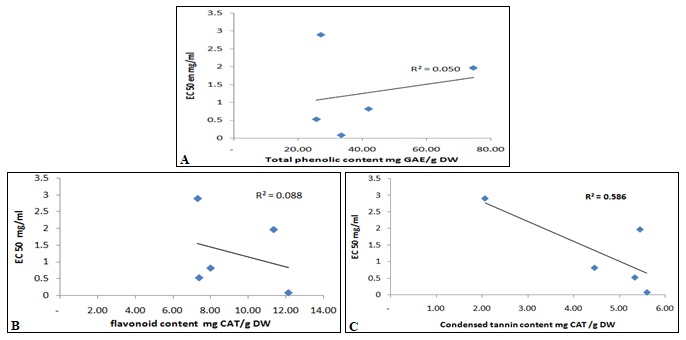
FIG. 9: CORRELATION BETWEEN DPPH RADICAL SCAVENGING ACTIVITY WITH TOTAL POLYPHENOL (A), FLAVONOID (B) AND CONDENSED TANNIN (C) CONTENTS
There was no correlation between total polyphenol contents and DPPH free radical scavenging activity (R2 = 0.05). Pearson correlation test performed by SPSS gave a P-value of 0.447>0.05 and a Pearson index of 0.144 confirming the absence of a significant correlation between total polyphenol contents and the antioxidant activity. Fig. 9B also shows the lack of a correlation between flavonoid amounts and DPPH free radical scavenging activity (R2 = 0.08). Pearson correlation test performed by SPSS gave a P-value>0.05and a Pearson index of 0.214 confirming the absence of a significant correlation between flavonoid contents and the antioxidant activity. Fig. 3C shows a strong correlation between condensed tannin content and DPPH free radical scavenging activity (R2 = 0.58).
Pearson correlation test performed by SPSS gave a P-value <0.05 and a Pearson index of 0.866 confirming the presence of a very strong correlation between condensed tannin amounts and the antioxidant activity. It is important to note that phenolic compounds correlation with the antioxidant potential is not consensual. Some authors reported this type of correlation 33, 34, however, in other studies, no correlation was observed.
The interpretation of these results must be made with caution because the final effect of such a complex product like plant extract is due to the combinatorial and synergy actions of all its components, which explains the positive correlation of DPPH radical scavenging activity with condensed tannin contents and the non-correlation with total polyphenol and flavonoid contents. Thus, other compounds, belonging to other chemical classes, can also contribute to the observed effects. Also, substances with antioxidant activity may exhibit a pro-oxidant behavior under some conditions 35.
CONCLUSION: It is obvious that phenolic compounds have important properties on various biological systems. From the first approach of this work, the quantification by spectrophotometric methods of different phenolic groups (flavonoids, and condensed tannins) led us to conclude that all studied leaf samples were rich in phenolic compounds with different amounts from one region to another. The HPLC analysis helped us to trace the polyphenolic profile of the leaves for each region and to show the absence of some polyphenols in some samples and their presence in other, such as gallic acid and caffeic acid.
The detection of protocatechuic acid supports the rare studies on Vitis vinifera L. that indicate its presence in the leaves whereas most studies did not confirm it. The screening of the antioxidant activity by two different methods allowed us to verify the antioxidant potential of the extracts and to identify the most active one, Aïn-Temouchent sample deserves to be highlighted for its strong antioxidant activity that exceeds even that of ascorbic acid.
The study of the correlation between the phenolic contents and the antioxidant activity, showed that in our study a high amount of total polyphenols is not necessarily associated to an important antioxidant activity, and that anti-radical power is much more related to the nature of the phenolic compound than to its concentration, in our work, it would seem that condensed tannins are responsible for the largest part of this activity. In the light of this modest work, it is obvious that many interrogations on red grape polyphenols and their biological effects remain unanswered, so many questions that make the study of polyphenols so challenging but very interesting.
ACKNOWLEDGEMENT: Nil
CONFLICT OF INTEREST: Nil
REFERENCES:
- Hussain MS: Current approaches toward the production of secondary plant metabolites. Journal of Pharmacy & Bioallied Sciences 2012; 4(1): 10-20.
- Baydar NG, G Özkan and Sağdiç O: Total phenolic contents and antibacterial activities of grape (Vitis vinifera) extracts. Food Control 2004; 15(5): 335-339.
- Fernandes F: Vitis vinifera leaves towards bioactivity. Industrial Crops and Products 2013; 43: 434-440.
- Xia EQ: Biological activities of polyphenols from grapes. Int J Mol Sci 2010; 11(2): 622-46.
- Bautista‐Ortín A: Improving color extraction and stability in red wines: the use of maceration enzymes and enological tannins. International Journal of Food Science & Technology 2005; 40(8): 867-878.
- Levadoux L, Benabderrabou A and Douaouri B: Ampélographie algérienne.Société nationale d'édition et de diffusion, 1971; 1(118): 11118.
- International organisation of wine and vine, OIV Vine and Wine Outlook 2008-2009. Paris Organisation Inter-nationale de la Vigne et du Vin, 2013; 84.
- Benmeziane F: Optimization of extraction parameters of phenolic compounds from Algerian fresh table grapes, ( vinifera). International Food Research Journal 2014; 21(3): 1025-1029.
- Ojeil A: Identification et caractérisation de composés phénoliques extraits du raisin château KSARA. Lebanese Science Journal 2010; 11(2): 117-131.
- Ying C and Wan D: Quantitative determination of total and individual flavonoids in stems and leaves of Buddleja davidii and Buddleja albiflora. Pharmacognosy Magazine 2012; 8(32): 273-279.
- Julkunen-Tiitto R: Phenolic constituents in the leaves of northern willows: methods for the analysis of certain phenolics. Journal of Agricultural and Food Chemistry 1985; 33(2): 213-217.
- Tabart J: Ascorbic acid, phenolic acid, flavonoid, and carotenoid profiles of selected extracts from Ribes nigrum. J of Agricultural and Food Chem 2011; 59(9): 4763-4770.
- Prieto P, Pineda M and Aguilar M: Spectrophotometric quantitation of antioxidant capacity through the formation of a phosphomolybdenum complex: specific application to the determination of vitamin E. Anal Biochem 1999; 269(2): 337-41.
- Sánchez-Moreno C: Review: Methods used to evaluate the free radical scavenging activity in foods and biological systems. Food Science and Technology International 2002; 8(3): 121-137.
- Yu, QM: Antioxidant effect of grapevine leaf extract on the oxidative stress induced by a high-fat diet in rats. Food Science and Biotechnology 2014; 23(3): 849-857.
- Pastrana-Bonilla E: Phenolic content and antioxidant capacity of muscadine grapes. J Agric Food Chem 2003; 51(18): 5497-503.
- Güler A and Candemir A: Total phenolic and flavonoid contents, phenolic compositions and color properties of fresh grape leaves. Türk Tarım ve Doğa Bilimleri 2014; 6(6): 778-782.
- Taware PB: Phenolic alterations in grape leaves, berries and wines due to foliar and cluster powdery mildew infections. Int J Pharm Biol Sci 2010; 1: 1-14.
- El-Babili F: Culinary Decoctions: Spectrophotometric determination of various polyphenols coupled with their antioxidant activities. Pharmaceutical Crops 2013; 4: 15-2.
- El-Waziry AM: Nutritive value assessment of ensiling or mixing Acacia and Atriplex using in-vitro gas production technique. Research Journal of Agriculture and Biological Sciences 2007; 3(6): 605-614.
- Ksouri R: Influence of biological, environmental and technical factors on phenolic content and antioxidant activities of Tunisian halophytes. Comptes Rendus Biologies 2008; 331(11): 865-873.
- Król A, Amarowicz R and Weidner S: Changes in the composition of phenolic compounds and antioxidant properties of grapevine roots and leaves (Vitis vinifera) under continuous of long-term drought stress. Acta Physiologiae Plantarum 2014; 36(6): 1491-1499.
- Katalinic V: Phenolic profile, antioxidant capacity, and antimicrobial activity of leaf extracts from six Vitis vinifera varieties. International Journal of Food Properties 2013; 16(1): 45-60.
- El-Khateeb AY: Phytochemical analysis and antifungal activity of fruit leaves extracts on the mycelial growth of fungal plant pathogens. Journal of Plant Pathology & Microbiology 2013; 4(9): 1-6.
- Schneider E, von der Heydt H and Esperester A: Evaluation of polyphenol composition in red leaves from different varieties of Vitis vinifera. Planta Med 2008; 74(5): 565-72.
- Teixeira A: Natural bioactive compounds from winery by-products as health promoters: A review. International Journal of Molecular Sciences 2014; 15(9): 15638.
- Monagas M: Commercial dietary ingredients from Vitis vinifera leaves and grape skins: antioxidant and chemical characterization. J Agric Food Chem 2006. 54(2): 319-27.
- Babikova P: Content of trans-resveratrol in leaves and berries of interspecific grapevine (Vitis sp.) varieties. Czech J Food Sci 2008; 26: 13-17.
- Wang J: Accumulation and transportation of resveratrol in grapevines treated by ultraviolet-C irradiation. Life Science Journal 2013; 10(2): 2532-2542.
- Katalinić V: Insight in the phenolic composition and anti-oxidative properties of vinifera leaves extracts. Croatian J of Food Science & Technology 2009; 1(2): 7-15.
- Mattivi F: Metabolite profiling of grape: flavonols and anthocyanins. Journal of Agricultural and Food Chemistry 2006; 54(20): 7692-7702.
- Jeffery D, Parker M and Smith P: Flavonol composition of Australian red and white wines determined by High- Performance Liquid Chromatography. Australian Journal of Grape and Wine Research 2008; 14(3): 153-161.
- Kim MY: Phenolic compound concentration and anti-oxidant activities of edible and medicinal mushrooms from Korea. Journal of Agricultural and Food Chemistry 2008; 56(16): 7265-7270.
- Malheiro R: Arbutus unedo leaves as a source of phytochemicals with bioactive properties. Industrial Crops and Products 2012; 37(1): 473-478.
- Fukumoto L and Mazza G: Assessing antioxidant and pro-oxidant activities of phenolic compounds. Journal of Agricultural and Food Chemistry 2000; 48(8): 3597-3604.
How to cite this article:
Selka MA, Achouri MY, Chenafa A and Toumi H: The study of polyphenolic compounds profile and antioxidant activity of Vitis vinifera L. leaves from Western regions of Algeria. Int J Pharmacognosy 2019; 6(1): 20-29. doi link: http://dx.doi.org/10.13040/IJPSR.0975-8232.IJP.6(1).20-29.
This Journal licensed under a Creative Commons Attribution-Non-commercial-Share Alike 3.0 Unported License.
Article Information
4
20-29
811
1430
English
IJP
M. A. Selka *, M. Y. Achouri, A. Chenafa and H. Toumi
Pharmacognosy Laboratory, Department of Pharmacy, University of Sidi Bel Abbes-22000, Colonel Othman Road, Sidi Bel Abbes, Algeria.
ad.selka@gmail.com
29 November 2018
08 January 2019
15 January 2019
10.13040/IJPSR.0975-8232.IJP.6(1).20-29
31 January 2019