


THE COMAPARATIVE DATA BETWEEN VARIOUS COMMERCIAL BRANDS OF TEA POWDERS AND GREEN TEA
HTML Full TextTHE COMPARATIVE DATA BETWEEN VARIOUS COMMERCIAL BRANDS OF TEA POWDERS AND GREEN TEA
M. Kranthi Kumar *, M. Ramesh, M. Vijaya, M. V. Sowmithri Kumar and M. Anil
Department of Pharmacognosy, Swami Ramananda Tirdha Institute of Pharmaceutical Sciences, Nalgonda - 508201, Andhra Pradesh, India.
ABSTRACT: Tea is composed of many compounds. These components have various effects depending upon the amount of tea ingested and the quality of the tea apart from that green tea having various useful properties which are helpful for the human body. The present communication describes about the about the “the comparative data between various brands of tea powders and green tea by using U.V. Spectrophotometer and TLC procedure for the estimation of caffeine content in commercial available tea samples and comparative data of caffeine content along with analysis of different brands of tea samples by comparing with the green tea powder. The present methods show a detailed description of the difference between commercial brands of tea powders and green tea. A possible explanation to account for the variability in green Tea and analysis of different samples is offered.
| Keywords: |
Caffeine, Spectrophotometer, TLC, Green Tea
INTRODUCTION: Tea is the most commonly and widely used soft beverage in the household. It acts as a stimulant for the central nervous system and skeletal muscles. That is why tea removes fatigue, tiredness, and headache. It also increases the capacity of thinking. It is also used for lowering body temperature. The principal constituent of tea, which is responsible for all these properties, is the alkaloid-caffeine. The amount of caffeine in tea leavers varies from sample to sample. Originally, it was thought that caffeine is responsible for the taste and flavor of the tea. But pure caffeine has been found to be a tasteless while substance.
Therefore, the taste and flavor of tea are due to some other substance present in it. There is a little example, some people boast their ability to drink several cups of coffee in evening and yet sleep like a long, on the other hand there are people who are so sensitive to caffeine that even a single cup of coffee will cause a response doubt that the popularity of the xanthenes beverages depends on their stimulant action, although most people are unaware of any stimulation. The degree to which an individual is stimulated by the given amount of caffeine varies from individual to individual. For boarding on the toxic.
The xanthene beverages also create a medical problem. They are dietary of a stimulant of the CNS. Often the physicians face the question of whether to deny caffeine-containing beverages to patients or not. Children are more susceptible than adults to excitation by xanthenes. For this reason, tea and coffee should be excluded from their diet.
Even cocoa is of doubtful value. It has a high tannin content may be as high as 50 mg per cup. The present investigation is undertaken. The comparative data between various commercial brands of tea powder and Green tea. The present experimental investigation will be an attempt to give scientific justification and various comparative details about tea samples.
MATERIALS AND METHODS:
Materials: different brands of tea powders and green tea powder.
Chemicals: Chloroform, lead acetate, water samples of tea leaves.
Apparatus: Bunsen burner, spectrophotometer, analytical balance, separating funnel, beaker, Glassford.
Extraction Procedure of Caffeine: Fifty grams of tea powder was taken from the tea bags and placed in a 1000-ml beaker to which 350 ml of water was then added. The whole was boiled for about 30 min and then filtered into another clean beaker. To the filtrate, 10% aqueous solution of lead acetate was added with constant stirring until no precipitate was seen. The resulting mixture was thoroughly stirred and then filtered by suction filtration.
The filtrate was transferred to another clean beaker and concentrated by boiling to a volume of about 25 ml. This was cooled to room temperature. Twenty-five milliliters of chloroform was added to the cold filtrate which was stirred thoroughly with a glass rod.
The resulting mixture was transferred into a clean separation funnel. When the mixture separated into two distinct layers, the lower chloroform layer was separated into a clean distillation flask. To the aqueous layer, 20 ml of chloroform was added, and the mixture was shaken well. After some time the two phases separated and the lower chloroform layer was once again collected into the China dish.
The aqueous layer was once again extracted with another lot of 20 ml of chloroform. Collect the chloroform in a pre-weighed china dish and allowed to evaporate the chloroform, the dry residue was scraped with a spatula and weighed using an analytical balance.
Purification of Crude Caffeine: The crude Caffeine is must Purify for removing of impurities for this; crude caffeine was purified by dissolving it in a small quantity of boiling water and then allowing it to cool undisturbed. The needle-shaped crystals of caffeine were filtered out and dried between folds of filter paper. A similar procedure was performed with different samples of tea leaves and quantify of caffeine observed in them. The percentage of Caffeine is calculated by using the following formula
Percentage of Caffeine = The weight of substance obtained × 100 / The weight of tea powder taken
Thin Layer Chromatography Technique (TLC): A sample of pure caffeine, crude caffeine, and purified caffeine were dissolved in Dichloro Methane Prepare TLC plates by using silica gel G pure caffeine was spotted on the TLC plates by using a new capillary spotted each time. Place the TLC plates into the mobile phage i.e. 9:1 ratio of chloroform and acetone. Placing the spotted end into the mixture. Allow to run the Mobile phase without any disturbance. Remove the plates from the mobile phase allow to dry then viewed under UV light and note the readings. Calculate the Rf value then viewed under UV light and note the readings. Calculate the the Rf values by using the following formula.
Rf Value = Distance traveled by the solute from origin line / Solvent Front
Procedure for the Analysis of Bulk Density: The bulk density of the powder is defined as the ratio of the mass of the powder to its bulk volume. For determination of the bulk density, a weighed quantity of tea powder was introduced into a graduated measuring cylinder. The measuring cylinder was tapped manually till a constant volume was obtained. This volume is known as the bulk volume of the tea powder. The same procedure was followed for each brand of tea powder.
Bulk Density = Mass of the Powder / Bulk Volume
RESULT AND DISCUSSION:
Caffeine Content: The results Table 1 and Fig. 1 show that Red Label Tea has the highest caffeine content of 2.4g/50 g of tea. The lowest caffeine content was seen in Tetley Green Tea, which had only 0.72 g. The other products fall in between, with Tata Tea having 2.06 g, Taj Mahal Tea 1.96 g, Gemini 1.70 g, and 3 Roses Tea 1.30 g and Chakra gold 0.96 g.
TABLE 1: CAFFEINE CONTENT OF THE SEVEN DIFFERENT BRANDS OF TEA POWDER
| Commercial Tea Brands | Weight of empty China Dish (W1) (gm) | Weight of empty China Dish With Precipitate (W2) (gm) | Weight of Caffeine Content (gm) | Percentage of Caffeine (%) |
| Red label | 88.74 | 89.94 | 1.2 | 2.4 |
| Taj Mahal | 104.67 | 105.65 | 0.98 | 1.96 |
| Chakra Gold | 93.85 | 94.33 | 0.48 | 0.96 |
| Gemini | 84.65 | 85.5 | 0.85 | 1.7 |
| 3 Roses | 95.66 | 96.31 | 0.65 | 1.3 |
| Tetley Green Tea | 98.59 | 98.93 | 0.34 | 0.72 |
| Tata Tea | 102.75 | 103.78 | 1.03 | 2.06 |
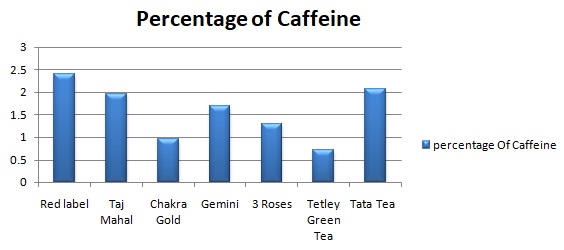
FIG. 1: CAFFEINE CONTENT OF THE SEVEN DIFFERENT BRANDS OF TEA POWDER
The Intensity of Color: In this experiment, the absorbency of each product was tested to determine the concentration of color. Fig. 2 shows that Chakra Gold and Tetley Green Tea had the lowest absorbency level at a wavelength of 450 nm of 0.329 and 0.216, respectively. Taj Mahal Tea had the highest absorbency level at the same wavelength (0.535). From these results, we concluded that Taj Mahal Tea has the highest concentration of caffeine.
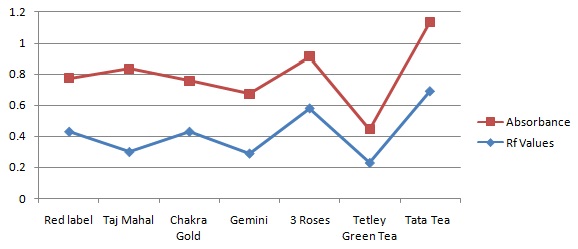
FIG. 2: RF AND ABSORBANCE VALES OF THE SEVEN DIFFERENT BRANDS OF TEA POWDER
TABLE 2: COLOR INTENSITY OF THE SEVEN DIFFERENT BRANDS OF TEA POWDER BY SPECTROPHOTOMETRY
| Brand of Tea Powder | Absorbance |
| Red label | 0.346 |
| Taj Mahal | 0.535 |
| Chakra Gold | 0.329 |
| Gemini | 0.385 |
| 3 Roses | 0.333 |
| Tetley Green Tea | 0.216 |
| Tata Tea | 0.443 |
The results showed that Tetley Green Tea Contains Very High density and Gemini Tea Contains low bulk density Table 3. That could be seen since the other five products were having bulk density between 0.41 to 0.45, i.e. the space occupied for air is more than the particles.
TABLE 3: BULK DENSITY OF THE SEVEN DIFFERENT BRANDS OF TEA POWDER
| Brand of Tea Powder | Bulk Density (g/ml) |
| Red label | 0.41 ± 0.022 |
| Taj Mahal | 0.45 ± 0.014 |
| Chakra Gold | 0.41 ± 0.023 |
| Gemini | 0.40 ± 0.002 |
| 3 Roses | 0.42 ± 0.025 |
| Tetley Green Tea | 0.56 ± 0.001 |
| Tata Tea | 0.42 ± 0.002 |

FIG. 3: BULK DENSITY OF THE SEVEN DIFFERENT BRANDS OF TEA POWDER
Tea Acidity and Taste: The results Fig. 3 and Table 4 showed that Tetley Green Tea had the lowest pH among the products tested, Taj Mahal and 3 Roses Tea showed a pH of 5.1, which ranks both products as having the highest pH. The rest of the products fall in between, with pH of 5.0. About the taste of the products, the results show a correlation between the pH and the taste. Red Label Tea and Tetley Green Tea with a pH of 4.6 had a very bitter taste that lingered on the tongue. On the other hand 3 Roses and Taj Mahal Tea and tasted only mildly bitter, which could be explained by their higher pH of 5.1.
TABLE 4: ACIDITY AND TASTE OF THE SEVEN DIFFERENT BRANDS OF TEA POWDER BY ABSORBANCE
| Tea Sample | Taste | pH |
| Red label | Very bitter | 4.6 ± 0.003 |
| Taj Mahal | Mild bitter | 5.1 ± 0.001 |
| Chakra Gold | Bitter | 4.8 ± 0.001 |
| Gemini | Bitter | 4.8 ± 0.001 |
| 3 Roses | Mild bitter | 5.1 ± 0.001 |
| Tetley Green Tea | Very bitter | 4.6 ± 0.001 |
| Tata Tea | Bitter | 4.9 ± 0.001 |

FIG. 4: pH OF THE SEVEN DIFFERENT BRANDS OF TEA POWDER
Rf values: The results Fig. 4 and Table 5 showed that Tetley Green Tea and Gemini Tea had lowest Rf values i.e. 0.23 & 0.29 Red label and Chakra Gold Tea powder contains similar Rf values (0.43).Tata Tea Powder contains highest Rf value of 0.69.
TABLE 5: RF VALUES OF SEVEN DIFFERENT BRANDS OF TEA POWDER
| Commercial Tea Brands | Rf values |
| Red label | 0.43 |
| Taj Mahal | 0.30 |
| Chakra Gold | 0.43 |
| Gemini | 0.29 |
| 3 Roses | 0.58 |
| Tetley Green Tea | 0.23 |
| Tata Tea | 0.69 |
CONCLUSION:
- Taj Mahal Tea and 3 Roses Tea have the highest pH, and they possess a mildly bitter taste. Red Label Tea and Green Tea have the lowest pH, with a very bitter taste.
- Taj Mahal Tea has the highest color concentration due to the high concentration of caffeine. Green Tea has the lowest color concentration due to the low concentration of caffeine.
- Green Tea has a high bulk density. That means more void volume, which indicates slightly different particle size distribution.
- When compared to other brands Red Label Tea has the highest caffeine content. Green Tea has the lowest caffeine content. Finally, the results conclude that The Green Tea contains less caffeine percentage and also less Caffeine concentration so it is very good for health and Taj Mahal Tea contains a high percentage of caffeine, so this may lead to quick relief and at the same time it also Causes addiction.
ACKNOWLEDGEMENT: Nil
CONFLICT OF INTEREST: Nil
REFERENCES:
- Encyclopedia of Chem Techol. Caffeine Wikipedia 3: 911.
- Goodman and Gillman. The Pharmacological basis of Therapeutics. 8th edition Vol. I, 1990: 620.
- A Scientific Status Summary by Institute of Food Technologist expert panel on Food Safety and Nutrition, Journal of Food Technol 2987; 41(6): 105-111.
- Indian Pharmacopoeia, 3rd edition, Vol. I, 1996: 81.
- British Pharmacopoeia, Vol. I, 1996: 95.
- Srivastava A, Sand NK and Gupta KC: Indian Drugs, 1992; 29(10): 459-461.
- ijnpnd.com on Wednesday, February 12, 2014, IP: 106.220.114.206
- Available from: http://www.stashtea.com/caffeine.htm. Last accessed on 2011 June 24.
- Availablefrom:http://chemistry.about.com/od/moleculescompounds//caffeine.htm. Last accessed on 2011 June 24.
- Availablefrom:http://www.chemistrydaily.com/chemistry caffeine#Chemical properties. Last accessed on 2011 June 24.
- Availablefrom:http://www.medchem.leidenuniv.nl/home/coffee and caffeine.htm. Last accessed on 2011 June 24.
- Availablefrom:http://www.medicinenet.com/caffeine/article.htm.Last accessed on 2011 June 24.
- Available from:http://www.nlm.nih.gov/medlineplus/ency/ article/002445.htm.Last accessed on 2011 June 24.
- Landolt HP, Rétey JV, Tönz K, Gottselig JM, Khatami R and Muller IB: Caffeine attenuates waking and sleep electroencephalographic markers of sleep homeostasis in humans. Neuropsychopharmacology 2004; 29: 1933-9.
- Availablefrom:http://www.imperialteagarden.com/teas.html. Last accessed on 2011 June 24.
- Dhaka NP and Kumar K: Project 4: To isolate caffeine from the given tealeaves Laboratory skills-Chemistry. Pradeep Publications, India 1st ed 2006: 124-5.
- Agarwal SP and Khanna R: Micromeritics and powder rheology, Physical pharmacy. 2nd New York: CBS Publishers and Distributors 2006: 41-2.
- Brown TL, Lemay HE and Bursten BE: Acid-base equilibria, Chemistry the Central Science. 10th New Jersey, USA: Pearson Prentice Hall Publisher 2006: 681-2.
How to cite this article:
Kumar MK, Ramesh M, Vijaya M, Kumar MVS and Anil M: The comparative data between various commercial brands of tea powders and green tea. Int J Pharmacognosy 2014; 1(3): 216-21. doi: 10.13040/IJPSR.0975-8232.1(3).216-21.
This Journal licensed under a Creative Commons Attribution-Non-commercial-Share Alike 3.0 Unported License.
Article Information
9
216-221
539
3461
English
IJP
M. K. Kumar *, M. Ramesh, M. Vijaya, M. V. S. Kumar and M. Anil
Department of Pharmacognosy, Swami Ramananda Tirdha Institute of Pharmaceutical Sciences, Nalgonda, Andhra Pradesh, India.
mkranthikumar012@gmail.com
07 December 2013
21 February 2014
28 February 2014
http://dx.doi.org/10.13040/IJPSR.0975-8232.1(3).216-221
01 March 2014