PLURONICF-68 BASE EUDRAGIT –SILYMARIN NANOPARTICLES TO OPTIMIZE ITS BIOAVAILABILITY
HTML Full TextPLURONICF-68 BASE EUDRAGIT –SILYMARIN NANOPARTICLES TO OPTIMIZE ITS BIOAVAILABILITY
Radhika N. Kotame * and Kratika Daniel
Oriental University, Indore, Madhya Pradesh, India.
ABSTRACT: Objectives: Silymarin is an anti-inflammatory agent that is used in the treatment of a variety of inflammatory disorders. The aim of the present study was to prepare and evaluate novel polymeric nanoparticles containing Silymarin. Materials and Methods: A 32 full factorial design was used to study the effect of Eudragit EPO and Pluronic F-68 on the characterization of nanoparticle suspensions. The polymeric nanoparticles were prepared by Nano precipitation technique. The prepared nanoparticles was evaluated by percentage yield, drug polymer compatibility using Fourier transform infrared (FTIR) spectroscopy and differential scanning calorimetric (DSC) analysis, drug content, entrapment efficiency, zeta potential, particle size, scanning electron microscopy, X-ray diffraction, in-vitro drug release studies, kinetic modelling, stability studies, and in-vivo animal studies. Results: The DSC study revealed that the drug was involved in complexation with nanoparticles. The average particle size of Silymarin nanoparticles was in the range of 114.4 nm to 136.7 nm. The zeta potential values were attained to ensure good stability of nanosuspensions. In-vitro release of the drug from nanoparticles follows the Peppasmodel and showed controlled release behaviour for a period of 24 h. The optimized nanoparticles were subjected to stability studies at 4°C in a refrigerator and the most suitable temperature for storage of Silymarin nanoparticles found. Conclusion: Silymarin loaded nanoparticles was found to be effective in sustained release.
Keywords: Silymarin, Eudragit EPO, Pluronic F-68, 32 full factorial design, nanoparticles
INTRODUCTION: Ultrafine particle, commonly known as a nanoparticle, is matter consists of a subdivisions with size range 1 to 100 nm as per diameter. The word for subdivisions up to 100nm in diameter or in other cases is tubes or fibres with a diameter of 100 nm or less. The atomic clusters are metal particles smaller than 1 nm 1.
Nanoparticles are generally different from different types of particles such as coarse (2500 to 10,000nm), micro (11000 μm), fine (100 to 2500 nm) thus having different types of physical and chemical properties (Brownian motion, optical effect, electrical properties, colloidal properties to prevent deposition phenomenon 2-3.
Nanoparticles cannot be seen with a conventional optical microscope, necessitating the use of an electron microscope or a laser microscope, because of the wavelengths under visible light (400-800 nm) and hence the separation. The dispersion consists of nanoparticles of transparent nature while the larger particles in the suspension scatter light. Nanoparticles also pass easily through ordinary ceramic candles or conventional filters 4. The benefits of nanoparticles to present day medication are various. Without a doubt there are a few occasions where nanoparticles empower investigations and treatments that basically cannot be performed something else. Be that as it may, nanoparticles too bring with them special natural and societal challenges, especially in respect to harmfulness 5-6. This survey points to highlight the major commitments of nanoparticles to cutting edge medication conjointly examine natural and societal angles of their use 7-8.
The main source of Silymarin is obtained from milk thistle seeds, the active ingredient of traditional Silybummarianum, it is a hepatoprotectant, used in the treatment of the liver also has anti-inflammatory activity, antiviral, antidiabetic, lipid-lowering. The main components of silymarin are silibinin A and silibinin B (70- 80%), it is responsible for the main beneficial action. Further components namely silycristin, isosilybin a plus 9.
Nowadays, phytotherapeutics obtained in the form of nanoparticles are used to improve their pharmacokinetic and pharmacodynamic properties. The sizes of the nanoparticles vary in diameter from 1 to 1000 nm and exhibit properties different from their equivalent particles at the macroscopic scale. The nanoparticles contain the embedded drug matrix. To obtain the above-mentioned advantages, new polyherbal nanoparticle carriers and preparation methods are being investigated 10.
MATERIALS AND METHODS: Drug was obtained as a gift sample from Strides Arco lab Limited, Bangalore Eudragit® -EPO and Pluronic F- 68 were provided as a gift sample from Cipla Pharmaceuticals, Mumbai, India and Alembic Pharmaceuticals, Mumbai.
Preformulation Studies: The goal of pre formulation research is to compile a library of knowledge about the drug material that will be beneficial for formulating the dosage forms. Investigation of the physical and chemical characteristics of the drug material alone and when mixed with excipients is known as preformulation 11.
UV Spectrophotometric Study:
Determination of λmax: The maximum absorbance of the standard drug solution was scanned from 200 to 400 nm (UV regions) on UV-Visible spectrophotometer Instrument 12.
FTIR Spectroscopy: The infrared spectrum was generally used as an identification parameter to know the chemical structure of drugs. For recording FTIR spectrum of Silymarin FTIR spectrophotometer was used 13.
Formulation of Polymeric Nanoparticles:
TABLE 1: VARIABLE LEVEL OF 32 FACTORIAL DESIGNING FOR SILYMARIN NANOPARTICLES
| Independent variables factor | Coded Levels | ||
| Lower (-1) (%w/v) | Middle (0) (%w/v) | Upper (+1) (%w/v) | |
| Eudragit–EPO(X1) | 0.3 | 0.45 | 0.6 |
| PluronicF-68 (X2) | 0.4 | 0.5 | 0.6 |
X1: Polymer Eudragit®EPO; X2: Stabilizer Pluronic®F-68.
Preparation of Polymeric Nanoparticle Suspension: Nanoparticle suspension of Silymarin was prepared by Nano precipitation method.
Both Silymarin 50 mg and specific amount of Eudragit®-EPO are dissolved in 15 ml of methanol. Quickly added the organic solution into 30 ml aqueous solution where the Pluronic® F-68 previously dissolved under stirring at 2000 rpm. Continued the Stirring for 2 h at 40°C for complete evaporation of methanol.
Then adjusted the volume up to40 ml with an aqueous solution of 200 mg of HPMC K-15 to obtain a nanoparticle suspension.
The optimized nanoparticle suspension was lyophilized at 42°C for 72 hours and which was also re-dispersed in water to get aqueous nanoparticle suspension 14.
FIG. 1: PREPARATION OF POLYMERIC NANOPARTICLES
Evaluation of Nanoparticles:
In-vitro Studies:
Practical Yield: The Percentage practical yield was calculated to know about the productivity of any method. Therefore, it helps in the choice of appropriate process of production. The practical yield was calculated as the weight of nanoparticles recovered from each collection in relative to the amount of starting material 15.
Estimation of Drug Content: Estimation of drug content / drug loading is the ratio of the drug weight to the total weight of the carrier system including all excipients taken together. The nanoparticles formulations were diluted with methanol. Final volume was made with solvent and drug content were assessed by using UV - Visible spectrophotometer at 287 nm against blank.
Estimation of Entrapment Efficiency: The entrapment efficiency is defined as the ratio of the amount of drug entrapped in nanoparticles to the total amount of drug added to the formulation. It was estimated by calculating the concentration of free drug in the dispersion medium. The entrapped amount of drug was estimated by the addition of 1ml nanosuspension to 9 ml methanol to dissolve the entrapped drug. Nanoparticles suspension was used to centrifuge for 2 h at 14000rpm. The supernatant liquid was separated and filtered through 0.45μm Whattman filter paper.
Particle Size Analysis: Particle size and size distribution of nanoparticles were carried out by Malvern Mastersizer. This technique produces the mean particle diameter and particle size distribution. All the samples were analyzed using Mastersizer 2000 (Malvern Instruments, Malvern, UK).
Scanning Electron Microscopy Analysis: Surface morphological character and shape of nanoparticles was photographed using scanning electron microscopy.
It was used to find out the particle shape, surface structure, roughness of particles and examine the morphological character of fractured structure. The small volume of sample is sufficient to mount on metal stubs using double-sided tape with gold coat under vacuum. The stub was visualized under scanning electron microscope 16.
Zeta Potential Measurement: A surface charge of particles in dispersive system is due to adsorption of ions or ionization of surface groups, then the charge dependent on both surface chemistry and the environment of the particles.
Zeta potential was determined by zeta potentiometer. The sample was filled into the cell; an electrode inserted was placed under the microscope and connect them to the zeta meter 17.
X-ray Diffractometry Analysis: The X- ray Diffraction pattern of drug physical mixture and nanoparticles obtained before and after lyophilisation process nanoparticles was recorded using Philips X ray diffractometer with copper target 18.
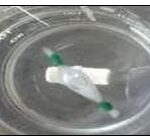
In-vitro Drug Release Studies: In-vitro release of drug from raw materials and polymeric nanoparticles was performed by following the dialysis membrane method. The formulation equivalents to 50 mg of drug was poured into dialysis bags (with a cut-off of 12,000 Da, Sigma).
Suspended drug loaded dialysis bag in a beaker with 100 ml of phosphate buffer saline pH 7.4 on a magnetic stirrer at 100 rpm, with temperature adjusted to 37±0.5°C at selected time intervals. Withdrawn 5 ml sample for drug analysis and same volume of fresh buffer was replaced.
Filtered the samples withdrawn through 0.45μm Millipore filter. The samples were analyzed for drug release by determining absorbance at 287 using UV-Visible spectrophotometer, the rate of Silymarin release obtained using the standard curve 19.
FIG. 2: SCHEMATIC ASSEMBLY OF DIALYSIS MEMBRANE METHOD FOR DRUG RELEASE
Kinetics of In-vitro Drug Release Studies: This study was carried out to understand the mechanism and kinetics of drug release, the results of the in-vitro drug release data were fitted into many kinetic equations.
Statistical Analysis: The surface response methodology explains the relationship between several explanatory variables and one or moreresponse variables. A previous information and understanding of the process and the variable under checkled to preliminary experiments. From preliminary data, the 32 factorial design helpful to optimize the amount of polymer Eudragit®-EPO (x1) and stabilizer Pluronic®F-68 (x2) this as identified as the in dependent variable and Response like the drug content and the percentage drug encapsulation efficiency identified as dependent variable. The data analysis of values obtained from various batches f or drug content and encapsulation efficiency was subjected to multiple regression analysis using PCP dissolution software the equation fitted 20
Stability Studies: The stability studies of the optimized nanosuspensions were evaluated by storing nanoformulation at 5° ± 3ºC in refrigerator and 25° ± 2°C, 60% ±5% RH for one year (Long term stability) and 40ºC ±2ºC/75% ±5% RH (Accelerated stability) in humidity control oven for 6monthsasper guidelines of ICH. The nanoparticles was kept in screw capped amber-glass bottles. Physical instability like change in appearance, settling behaviour was observed. The samples were withdrawn and analysed for its percent drug content, percent drug entrapment efficiency and in-vitro drug release profile.
Bioavailability Studies: The bioavailability studies were performed on drug and optimized nanoparticles. Healthy weights of rats 200-250 g were used for this study. The rats were allowed for free access to standard laboratory diet 21.
Tissue Distribution Studies: The animals are divided into 3 groups, each containing 6 rats (80). Group I rats treated as a control. Group II rats received 9 mg/kg of Silymarin orally; Group III rats received nanoparticles equivalent to 9 mg/kg of Silymarin given orally after redispersing them in 0.5% CMC solution, optimized formulation was selected for the study. After 24 hour the rats were sacrificed and their liver, lungs, spleen, kidney, heart and brain were secluded. Separated organs of each rat homogenized separately by using a tissue Homogenizer and the homogenate centrifuged at 15,000 rpm for 30 min, collected supernatant liquid, filtered through 0.22 µm filters and concentration of Silymarin samples was analyzed 22.
Results and Analysis:
UV Spectrophotometric Study: Absorption maximum for Silymarin in methanol found to be 287 nm and spectrum shown in Figure and maximum absorbance of Silymarin in PBS were also found to be 284 nm and the spectrum shown in Fig.
FIG. 3: MAXIMUM ABSORBANCE AT 287 (A) REFERENCE, (B) IN METHANOL AND (C) PBS
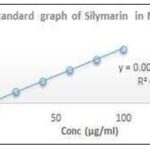
Calibration curve of Silymarin: Ultraviolet absorption spectroscopy was used as an analytical method for the analysis of drug content, entrapment efficiency and in-vitro drug release using methanol and phosphate buffer saline H7.4 respectively.
The solutions absorbance (containing concentration 20µg/Ml of Silymarinin methanol and in phosphate buffer saline pH7.4) was scanned between 400nm to 200nm. The observed wavelength were 287.
FIG. 4: DATA OF CONCENTRATION AND ABSORBANCE FOR SILYMARININ METHANOL
FTIR Spectroscopy: The FTIR spectrum of Silymarin shown in Figure and the interpretations of IR frequencies were shown.
FIG. 5: FTIR SPECTRA OF SILYMARIN
Evaluation of Polymeric Nanoparticles:
Practical Yield: The results of percentage practical yield are shown in table
TABLE 2: DATA OF PERCENTAGE YIELD
| S. no. | Formulation code | Percentage Yield* |
| 1 | F1 | 58.66±0.461 |
| 2 | F2 | 65.10±0.386 |
| 3 | F3 | 68.33±0.288 |
| 4 | F4 | 66.47±0.329 |
| 5 | F5 | 68.66±0.288 |
| 6 | F6 | 75.33±0.230 |
| 7 | F7 | 69.18±0.259 |
| 8 | F8 | 72.93±0.230 |
| 9 | F9 | 73.44±0.190 |
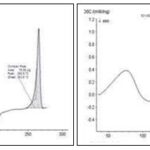
DSC Thermogram: DSC analysis is an important and informative study about quantity, quality and physicochemical properties of drug in nanoformulation. DSC thermogram of drug and polymeric nanoparticle are shown in Figures.
Differential Scanning Calorimetry:
FIG. 6: DSC THERMOGRAM OF (A) SILYMARIN, AND POLYMERIC SILYMARIN NANOPARTICLES
TABLE 3: DATA OF PERCENTAGE DRUG CONTENT
| S. no. | Formulation code | Percentage Drug Content* |
| 1 | F1 | 61.86±0.130 |
| 2 | F2 | 67.43±0.075 |
| 3 | F3 | 72.87±0.015 |
| 4 | F4 | 82.21±0.075 |
| 5 | F5 | 86.25±0.075 |
| 6 | F6 | 88.36±0.075 |
| 7 | F7 | 85.90±0.080 |
| 8 | F8 | 87.66±0.130 |
| 9 | F9 | 89.50±0.130 |
Estimation of Entrapment Efficiency: The percentage entrapment efficiency of polymeric nanoparticles is shown in table.
TABLE 4: DATA OF PERCENTAGE ENTRAPMENT EFFICIENCY
| S. no. | Formulation Code | Percentage Entrapment Efficiency* |
| 1. | F1 | 48.96±0.135 |
| 2. | F2 | 54.40±0.150 |
| 3. | F3 | 59.97±0.198 |
| 4. | F4 | 81.82±0.274 |
| 5. | F5 | 88.23±0.276 |
| 6. | F6 | 94.28±0.198 |
| 7. | F7 | 89.95±0.202 |
| 8. | F8 | 92.42±0.430 |
| 9. | F9 | 94.10±0.135 |
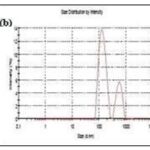
Particle Size Analysis: The important evaluation parameters in nanocrystal will be its particle size. The values for the determination of particles size and poly dispersity index were given table.
TABLE 5: DATAOFMEAN PARTICLE SIZEAND POLY DISPERSITY INDEX
| S. no. | Formulation Code | Particle size (nm *) | Poly Dispersity Index* |
| 1. | F1 | 114.4±0.305 | 0.734±0.002 |
| 2. | F2 | 125.5±0.862 | 0.715±0.001 |
| 3. | F3 | 134.6±0.200 | 0.707±0.002 |
| 4. | F4 | 128.5±0.100 | 0.564±0.005 |
| 5. | F5 | 129.3±0.100 | 0.548±0.001 |
| 6. | F6 | 131.4±0.057 | 0.522±0.001 |
| 7. | F7 | 134.4±0.115 | 0.693±0.001 |
| 8. | F8 | 135.3±0.152 | 0.684±0.002 |
| 9. | F9 | 136.7±0.100 | 0.656±0.005 |
| Blank | 136.3±0.208 | 0.526±0.002 |
*Average of three determinations ± SD
FIG. 7: PARTICLE SIZE DISTRIBUTION OF (A) FORMULATION F3, (B) FORMULATION F6, AND FORMULATION F9
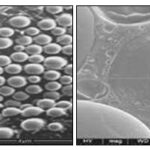
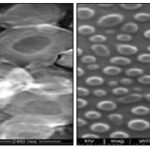
Scanning Electron Microscopy Analysis: Shape and surface morphology of nanoparticles studied by Scanning Electron Microscopy (SEM) Technique. SEM photograph was shown in two magnifications (50X & 2500X power.
FIG. 8: SEM IMAGES OF PURE SILYMARIN
FIG. 9: SEM IMAGES OF FORMULATION F3
FIG. 10: SEM IMAGES OF FORMULATION F6
FIG. 11: SEM IMAGES OF FORMULATION F9
The results of scanning electron microscopy indicated, that the nanoparticles are formed as spherical with smooth surface, mono-dispersed pattern confirmed the slow release of the drug. Furthermore, the size was also an important factor influencing the release rate.
Zeta Potential Measurement: The stability of polymeric nanoparticle can be ensured by zeta potential measurement. The values of zeta potential are shown in table.
The results indicate the repulsive force of attraction between particles. Hence prevents aggregation. The zeta potential measurement as represented in figures.
TABLE 6: DATAOF ZETA POTENTIAL
| S. no. | Formulation Code | Zeta potential (mV*) |
| 1 | F1 | 18.30±0.135 |
| 2 | F2 | 19.46±0.305 |
| 3 | F3 | 20.2±0.115 |
| 4 | F4 | 24.6±0.200 |
| 5 | F5 | 25.6±0.200 |
| 6 | F6 | 26.2±0.208 |
| 7 | F7 | 22.3±0.152 |
| 8 | F8 | 23.6±0.200 |
| 9 | F9 | 24.60±0.152 |
| Blank | 26.50±0.208 |
*Average of three determinations ± SD
FIG. 12: ZETA POTENTIAL REPORT OF (A) FORMULATION F3, FORMULATION F6, AND FORMULATION F9 X RAY
Diffractometry Analysis: The x-ray diffraction pattern was shown in figure.
FIG. 13: XRD SPECTRA OF (A) SILYMARIN, (B) PHYSICAL MIXTURE OF SILYMARIN AND POLYMERS (C) POLYMERIC NANOPARTICLES (BEFORE LYOPHILISATION) AND (D) SILYMARIN LOADED POLYMERIC NANOPARTICLES (AFTER LYOPHILISATION)
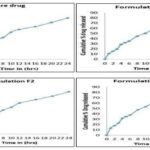
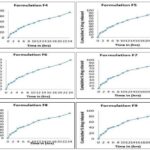
In-vitro Drug Release Studies: The drug release study of polymeric nanoparticle was performed by using the dialysis membrane method the results were shown in table.
FIG. 14: COMPARISON GRAPH FOR DRUG RELEASE STUDY OF PURE DRUG, F1, F2, F3, F4 & F5
FIG. 15: COMPARISON GRAPH FOR DRUG RELEASE STUDY OF PURE DRUG, F4, F5, F6, F7, F8 AND F9
Statistical Analysis:
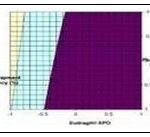
FIG. 16: (A) RESPONSE SURFACE PLOT SHOWING THE EFFECT OF FACTORIAL VARIABLES ON DRUG CONTENT, (B) RESPONSE SURFACE PLOTS SHOWING THE EFFECT OF FACTORIAL VARIABLES ON ENTRAPMENT EFFICIENCY, AND (C) CONTOUR PLOT SHOWING THE EFFECT OF FACTORIAL VARIABLES ON DRUG CONTENT
FIG. 17: CONTOUR PLOT SHOWING EFFECT OF FACTORIAL VARIABLES ON ENTRAPMENT EFFICIENCY
Stability Studies: Stability studies were done to investigate the effect of storage conditions on the physicochemical characteristics of nanosuspensions and also to find out the most suitable storage condition.
Hence the optimized formulation F6 subjected to the stability study based on in-vitro evaluation parameters.
TABLE 7: DRUG CONTENT DURING STABILITY
| S. no. | Time Periods | *Drug content | ||
| 5°±3°C | 25°±2/60±5%RH | 40°±2°C/75±5%RH | ||
| 1 | 0 | 88.36±0.075 | 88.36±0.075 | 88.36±0.075 |
| 2 | 3 months | 88.23±0.020 | 88.22±0.015 | 88.15±0.015 |
| 3 | 6 months | 88.03±0.152 | 88.14±0.020 | 87.94±0.025 |
| 4 | 9 months | 87.95±0.026 | 88.02±0.011 | - |
| 5 | 12 months | 87.69±0.043 | 87.89±0.005 | - |
All the value sex pressed as mean ± S.D., n=3
Bioavailability Studies:
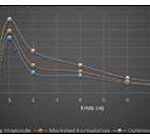
TABLE 8: PHARMACOKINETIC PARAMETERS
| Parameters | Pure drug | Marketed Formulation | Optimized Nanoparticles |
| Cmax (μg/mL) | 1.23±0.01 | 1.37±0.01 | 1.63±0.01* |
| Tmax (h) | 1.00±0.00 | 1.00±0.00 | 1.00±0.00 |
| t1/2 (h) | 2.60±0.06 | 2.37±0.37 | 1.05±0.06* |
| AUC0→8 (μg-h/mL) | 5.77±0.66 | 6.89±0.37 | 7.11±0.15* |
| Ke (h-1) | 0.267±0.005 | 0.294±0.04 | 0.652±0.03* |
| Fr (%) | - | 119.41 | 123.22 |
All values are expressed as mean ± S.D., n=3; *Significant (p<0.05) compared to pure drug
FIG. 18: PLASMA DRUG CONCENTRATION-TIME CURVE
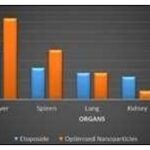
Tissue Distribution Studies: In-vivo tissue distribution study was carried out for pure drug and optimized formulation F6. The percentage drug recovered in the tissues of various organs for Silymarin nanoparticles was compared with that of free Silymarin. The comparison was made between the amount of drugs targeted from nanoparticles (formulation with highest drug content) and pure drug Silymarin in various organs is represented. The figure shows collective is play of isolate organs of rats. The results are shown in table and figure.
FIG. 19: COLLECTIVE DISPLAY OF ISOLATED ORGANS (A) SECLUDED LIVER, (B) SECLUDED SPLEEN, (C) SECLUDED KIDNEY, (D) SECLUDED LUNGS, AND (E) SECLUDED BRAIN
TABLE 9: TISSUE DISTRIBUTION
| Organ | Percentage drug recovered in tissue* | |
| Silymarin | Optimized Nanoparticles | |
| Liver | 28.47±0.041 | 41.88±0.030 |
| Spleen | 16.40±0.080 | 25.66±0.320 |
| Lung | 13.79±0.195 | 13.82±0.090 |
| Kidney | 11.83±0.065 | 4.52±0.300 |
| Brain | 3.63±0.180 | 4.18±0.49 |
∗Results are expressed as mean ± standard deviation (𝑛= 3)
The average targeting efficacy of Silymarin loaded nanoparticles was found to be 41.88% of the injected as dose in liver, 25.66% in spleen, 13.82% in the lungs, 4.52% in kidney, 4.18% in the brain as compared to the concentration of pure drug was 28.47% in the liver, 16.40%in spleen, 13.79% in the lungs, 11.83% in kidney, 3.63% in the brain. The Silymarin loaded nanoparticles exhibited better drug targeting to liver followed by spleen, lungs, kidney and brain.
The results of the study shown that Silymarin loaded nanoparticles exhibited favoured drug targeting to liver followed by spleen, lungs, kidney and brain. It was also shown that, as compared to pure drug, higher drug concentration was found and targeted to the organs like the liver and lungs after administering the dose in the form of nanosuspensions. This may lead to endorsed high macrophage load in these organs besides larger size of liver as compared to spleen and lungs.
FIG. 20: TISSUE DISTRIBUTION STUDIES
CONCLUSION: Silymarin loaded nanoparticles were successfully prepared. Preformulation study was performed for Silymarin drug. The initial part of work was started from the identification of drug. Identification of drug was determined by melting point, solubility, FTIR Spectroscopy, UV Spectroscopy and Assay. The drug loading efficiency of all nanoparticles showed acceptable range. The compatibility studies by FTIR and DSC analysis of nanoparticles suggest that there is no incompatibility of drug with polymer and surfactant. The shape of nanoparticles was found to be smooth with spherical by SEM analysis. The particle size data exhibited that nanoparticles formed were in nanosized and low polydispersity index which specifies fairly narrow particlesize distribution for all formulations. Zeta potential of nanosuspension was found to possess the optimum surface free energy, which indicates good stability with no agglomeration. Formulation F6 showing the most desired complete drug release. Formulation F6 followed the steady drug release pattern, which was estimated with Peppas release kinetic mechanism. The optimized formulation F6 was subjected to stability and in-vivo studies. The stability studies shown that nanosuspension are stable at 5ºC followed by 25ºC and 40ºC. The studies revealed that, there were no much significant changes in drug content, entrapment efficiency and in-vitro drug release during stability testing period. Bioavailability study shown significant and greater extent of absorption of Silymarin polymeric nanoparticles than pure drug and marketed formulation. The tissue distributions studies shown that Silymarin loaded nanoparticles exhibited favored drug targeting to liver followed by spleen, lungs, kidney and brain. It was also shown that, as compared to pure drug, higher drug concentration was found and targeted to the organs like the liver and lungs after administering the dose in the form of nanosuspension.
ACKNOWLEDGEMENT: Nil
CONFLICT OF INTEREST: Nil
REFERENCES:
- Shobha Rani R.H. Textbook of Industrial Pharmacy, 1stedn.,, Orient Longman Private Ltd, Chennai 2008; 1-7, 76, 91-95.
- Robinson JR and Lee VHL: Controlled drug delivery fundamentals and applications, 2nd edn, In forma Health care, Inc., New York 2009; 462-463.
- Vyas S and Khar RK: Controlled Drug Delivery Concepts and Advances In: Systems for Colon Specific Drug Delivery. 1st edn. Vallabh Prakashan, New Delhi 2002; 1-9.
- Banker SG and Rhodes CT: Modern Pharmaceutics, 4th,, Marcel Dekker, Inc, New York 2008; 529-576.
- Gupta Manish and Sharma Vimukutha. Targeted Drug Delivery System: A Review, Research Journal of Chemical Sciences 2011; 1(2): 135-138.
- Ronald J. Neufeld., Catarina Pinto Reis, Antonio J. Ribeiroand Francisco Veiga. Nanoencapsulation methods for preparation of drug-loaded polymeric nanoparticles. Nanotechnology, Biology and Medicine 2006; 2: 8-21.
- Pushpendra Goswami and Shilpa Subhedar Nanotechnology: Role and Future Trends in Pharmacy. Journal of Pharmacy Research 2011; 4(11): 4021-4024.
- Gadad A, Soni A, Dandagi P and Mastiholimath V: Nanotechnology in drug delivery- A Review. Indian Drugs 2011; 48(11): 5-15.
- More MP, Chitalkar RV and Bhadane MS: “Development of graphene- drug nanoparticle based supramolecular self-assembled pH sensitive hydrogel as potential carrier for targeting MDR tuberculosis,” Materials Technology 2019; 34(6): 324–335.
- El-Nahas E, Allam AN, Abdel Monsif DA and ElKamel AH: “Silymarinloaded eudragit nanoparticles: formulation, characterization, and hepatoprotective and toxicity evaluation. AAPS Pharm Sci Tech 2017; 18(8): 3076–3086.
- Gadha HF Raina. Diazepam loaded solid lipid nanoparticles: design and characterisation. American Association of Pharmaceutical Sciences, Pharma Sci Tech 2009; 10(1): 219-221.
- Doijad RC, Manvi FV, Godhwani DM, Joseph R and Deshmukh NV: Formulation and targeting efficiency of cisplatin engineered solid lipid nanoparticles. Indian Journal of Pharmaceutics Sciences 2008; 70(2): 203- 207.
- Nanjwade, Basavaraj K, Hiremath, Gurudev M, Manvi FV, Srichana and Teerapon: Formulation and Evaluation of Etoposide Loaded Aquasomes. Journal of Pharmaceutics and Drug Delivery 2013; 1(1): 92-101.
- Santamaría-AguirreJ, Alcocer-Vallejo R and López-Fanárraga M: Drugnanoparticle stability assessment using isothermal and nonisothermal approaches. Journal of Nanomaterials 2018; 147-181.
- Golla K, Cherukuvada B, Ahmed F and Kondapi AK: Efficacy, safety and anticancer activity of protein nanoparticle-based delivery of doxorubicin through intravenous administration in rats. Int J Pharm 2012; 7(12): 519-526.
- Sharma M, Sharma R and Jain DK: Nanotechnologybased approaches for enhancing oral bioavailability of poorly water soluble antihypertensive drugs. Scientifica 2016; 190-195.
- Ashraf M, Hayat MM, Nasim FH, Ahmad I, Saleem M and Rahman J: Development and validation of RP-HPLC method for the simultaneous determination ofetoposide and cisplatin and its application in quality control of injectable dosage forms. Journal of the Chemical Society of Pakistan 2012; 34(2): 321-325.
- Parveen S and Sahoo SK: Polymeric nanoparticles for cancer therapy. Journal of Drug Targeting 2008; 16(2): 108-23.
- Zhang Guoliang, Liu Liang, Jin Ping, Cheng Ming and Zhang Fengbao: 5- Fluorouracil-loaded self- assembled pH-sensitive nanoparticles as novel drug carrier for treatment of malignant tumors. Chinese Journal of Chemical Engineering 2006; 14(3): 377—382.
- Gadha and HF Raina: Diazepam loaded solid lipid nanoparticles: design and characterisation. American Association of Pharmaceutical Sciences, Pharma Sci Tech 2009; 10(1): 219-221.
- Doijad RC, Manvi FV, Godhwani DM, Joseph R and Deshmukh NV: Formulation and targeting efficiency of cisplatin engineered solid lipid nanoparticles. Indian Journal of Pharmaceutics Sciences 2008; 70(2): 203- 207.
- Nanjwade, Basavaraj K, Hiremath, Gurudev M, Manvi FV, Srichana and Teerapon: Formulation and Evaluation of Etoposide Loaded Aquasomes. Journal of Pharmaceutics and Drug Delivery 2013; 1(1): 92-101.
How to cite this article:
Kotame RN and Daniel K: Pluronicf-68 base eudragit –silymarin nanoparticles to optimize its bioavailability. Int J Pharmacognosy 2024; 11(3): 107-19. doi link: http://dx.doi.org/10.13040/IJPSR.0975-8232.IJP.11(3).107-19.
This Journal licensed under a Creative Commons Attribution-Non-commercial-Share Alike 3.0 Unported License.


