


PHYTOCHEMICAL SCREENING, ANALYTICAL METHOD DEVELOPMENT AND VALIDATION FOR THE DETERMINATION OF CATECHINS IN B. CILIATA BY RP-HPLC
HTML Full TextPHYTOCHEMICAL SCREENING, ANALYTICAL METHOD DEVELOPMENT AND VALIDATION FOR THE DETERMINATION OF CATECHINS IN B. CILIATA BY RP-HPLC
N. D. V. R. Saradhi *, N. Madan Gopal, C. Madhusudhna Chetty and K. Sushmitha
Santhiram College of Pharmacy, NH - 40, Nerawada, Kurnool - 518112, Andhra Pradesh, India.
ABSTRACT: Ayurveda an ancient system of medicines detailing a number of medicinal plants and their activities in humans or animals. The present research work aimed to develop an analytical procedure for the determination of catechins in the B. ciliata. It is famously known as a stone flower/stone breaker having biological activities like anti urolithiasis, antiviral, antidiabetic antitumor, and cardioprotective activity. The methanolic extract of the plant is isolated, and an analytical method is developed by using RP HPLC for the determination of catechins in the crude plant extract using a C18 column (200 × 4.6 mm, 5 µ) and detected at 241 nm. The method is validated for its system suitability, linearity, accuracy, precision, robustness, and sensitivity as per the ICH guidelines Q2 (R1) to meet the analytical procedure in academic and industrial usage.
| Keywords: |
B. ciliata, RP- HPLC, Catechins, Phytochemical screening etc.
INTRODUCTION: B. ciliata is one of the medicinal plants discussed in the Ayurveda system of medicine. The plant even though old but having many activities of it, the usage of the plant leaves and roots is more. B. ciliata belongs to Saxifragaceae is a perennial herb. The catechins are the phytochemicals having antioxidants, antimicrobial activity, and used in kidney ailments. The earlier work through the light that only a few methods have been enlisted in the method development of catechins in various plants. There is no report on the study for the estimation of catechins in B. ciliata with the selected stationary and mobile phases. The fresh leaves and rhizomes were collected from the Nandyal, Andhra Pradesh, and its surroundings, which were authenticated from the senior botanist Dr. V. J. Sailaja Rani. The plant authentication voucher number is KVSC/A/2019/P09. The plant parts were shade dried and extracted with methanol from the pure extract the RP HPLC method is developed for the estimation of catechins. The plant leaves and rhizomes are shown in Fig. 1.

FIG. 1: (A) LEAVES OF B. CILIATA (B) DRIED ROOTS OF B. CILIATA
MATERIALS AND METHODS: The chemicals used in the method were HPLC and AR grades, their percentage of purity between 99.98 - 100.02% (Chloroform, methanol, ethanol, acetone, distilled water). The pure form of the catechin was a gifted sample from the Hi Q Laboratory, Hyderabad.
The Soxhlet apparatus, volumetric flasks, beakers, round bottom flaks used for extraction and other procedures activities is borosil grade. The equipments are pre-calibrated electronic balance - Shimadzu (ATY 240), Ultrasonicator, Double Beam spectrophotometer – Shimadzu (UV- 1800), HPLC - Analytical technologies (2230) powered with N 2000 software, column – waters (B. No: 080606) – 200 × 4.6 mm, 5µ particle size stationary Phase were used for the experiment.
Plant Extraction: The shade dried leaves were grounded to a fine size and sieved through no: 44, the powder was packed in a muslin cloth and adjusted to a position of ¾ the level of Soxhlet apparatus. In a 250 ml of the round bottom flask was added about 200 ml of methanol and made hot percolation continued for 3 h, cooled the flask and make the crude extract was concentrated into solid on a rotary evaporator. The flakes of the crude drug were collected and stored in a SS bottle.
Mobile Phase / Diluent, Standard, and Sample Solutions: An equal portion of the HPLC Grade methanol and Chloroform (50:50 v/v) into a reservoir bottle, standard is prepared by weighing and diluting the standard catechin which is filtered through 0.25 µ membrane filter and the resultant concentration of catechin becomes 3 ppm level, and approximate level of the sample also prepared.
Phytochemical Screening: General tests were performed for both standard and sample solutions for the identification of various phytochemicals. The test performed for carbohydrates, fats, proteins, alkaloids, glycosides, resins, and tannins. Both show positive results for tannins and further identification tests conducted for identification of tannins by bromine water test and match stick test, which showed and confirmed the presence of catechins in the plant extract. A TLC method is used for the separation of catechins from the crude plant extract. A pre-coated TLC silica gel 60 F 254 aluminum sheet is used as a stationary phase and methanol, water, chloroform (35:10:65 v/v) is a mobile phase. The sample and standard applied on the plate and eluted for 20 min.
The plate was dried and sprayed with 0.55% vanillin in a 4% hydrochloric acid. The spots were scrapped and dissolved in the methanol. Now, this solution is measured for the absorbance to quantify the catechin present in the sample solution.
Measurement of Lambda Max: A spectrum plotted using diluent as blank to the sample, and standard solutions both are shown their lambda max at 241 nm. Fig. 2 represented as:
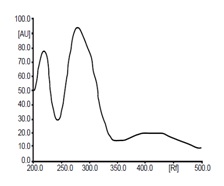
FIG. 2A: STANDARD CATECHIN
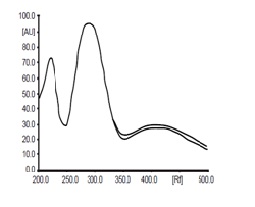
FIG. 2B: EXTRACT OF B. CILIATA OVER STANDARD CATECHIN
HPLC Method: Various trails have been conducted by changing the column conditions, mobile phase concentrations, and UV detection wavelengths. The final optimized method developed by using waters C18 (200 × 4.6 mm, 5µ) column with methanol, chloroform in 1:1 ratios, the flow rate maintained at 1ml/min. The chromato-grams of the placebo, sample, and standard were shown in Fig. 3, 4, 5.
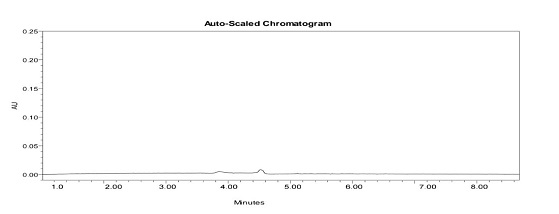
FIG. 3: BLANK / PLACEBO AT 241 nm
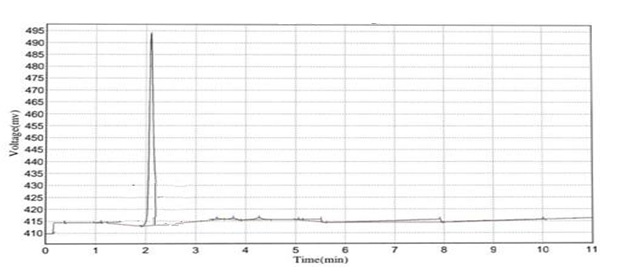
FIG. 4: STANDARD CATECHINS SHOWING PEAK AT 241 nm
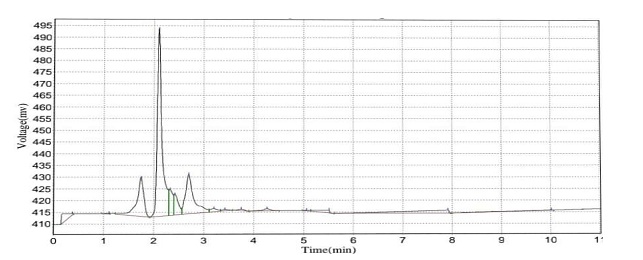
FIG. 5: PLANT EXTRACT SHOWING PEAK AT 241 nm
Validation of the Method:
System Suitability: This procedure validates that the selected procedure for the estimation of the catechins in B. ciliata by using the HPLC conditions. A replicate injection of the same concentration of the catechin standard is injected into the system and measure the peak area, mean, SD % RSD was calculated. The results were shown in Table 1.
Linearity: Linearity or range is a measure of analytical procedure that the selected method is suitable for the least to maximum concentrations. The selected procedure is followed for beer lambert law.
From the standard primary stock solution, 1-5 ml was taken into an individual volumetric flask and diluted with diluent to get 1-5 ppm. The peak response was measured for the individual concentration. The correlation between the individual concentrations was shown in Fig. 6.
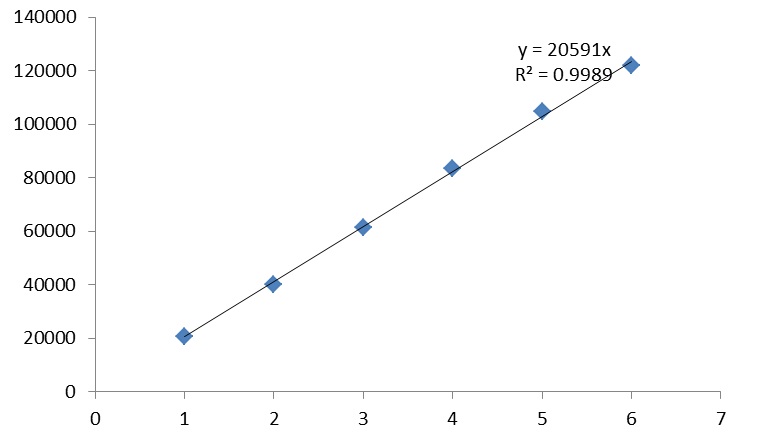
FIG. 6: LINEARITY
Precision: It is the agreement between individual test results with the procedure applied. The precision is completed in 3 steps repeatability, intermediate precision, and reproducibility. The procedure involves the replicate injection of the same concentration of the sample injected to the HPLC, the peak area was noted between the days, analysts, instruments, and laboratories, etc. the results were shown in Table 1.
Accuracy: It is a validated protocol for the measure the exactness of the experimental procedure. There are two ways for determining the accuracy compared to a reference method, recovery of the analyte spiked into a blank matrix and standard addition of the analyte. This can be done by taking 3 different concentrations of the sample and injected to the HPLC system, measure the peak area of each concentration, and calculate the percentage of recovery from each level of concentration. The results were shown in Table 2.
Robustness: it is a measure of the capacity of the developed method. The procedure involves the change in the system conditions like column flow rate, temperature, detection wavelength, etc. the results were Table 3.
Sensitivity: The sensitivity of the experiment can be calculated by the LOD/LOQ of the validation parameters. The LOD is the lowest limit of quantity to be determined using the developed procedure. LOQ is the highest minimum limit of quantity to be determined by using the procedure.
They were theoretically calculated using linearity graph for its signal to noise ratio, and the results are shown in Table 5.
RESULT:
TABLE 1: PRECISION
| Injection no. | Conc. in PPM | System suitability | Precision | |||
| Repeatability | Intermediate
precision |
Analyst
variation |
Instrument variation | |||
| 1 | 3 | 61587 | 61587 | 61597 | 61483 | 60823 |
| 2 | 3 | 61498 | 67570 | 61591 | 61532 | 59878 |
| 3 | 3 | 61481 | 61581 | 61599 | 61345 | 61233 |
| 4 | 3 | 61594 | 61594 | 61590 | 61563 | 60384 |
| 5 | 3 | 61595 | 61595 | 61596 | 61423 | 61482 |
| 6 | 3 | 61497 | 61597 | 61587 | 61082 | 62383 |
| Mean | 61542 | 61587 | 61595 | 61404 | 61030 | |
| Standard Deviation | 55.172 | 10.36 | 3.76 | 176.31 | 879.0 | |
| % RSD | 0.089 | 0.01 | 0.006 | 0.287 | 1.440 | |
| ICH Criteria | >2 | >2 | >2 | >2 | >2 | |
| Test Result | Passes | Passes | Passes | Passes | Passes | |
TABLE 2: ACCURACY
| S. no. | Accuracy level | Area | Spike added in mg | Recovered in mg | % Recovery |
| 1 | 50% | 31216 | 1.5 | 1.52 | 101.35 |
| 2 | 30682 | 1.5 | 1.49 | 99.62 | |
| 3 | 30429 | 1.5 | 1.48 | 98.80 | |
| 4 | 100% | 60394 | 3.0 | 2.93 | 98.04 |
| 5 | 60297 | 3.0 | 2.96 | 97.88 | |
| 6 | 62199 | 3.0 | 3.09 | 100.97 | |
| 7 | 150% | 91899 | 4.5 | 4.01 | 99.46 |
| 8 | 92385 | 4.5 | 4.52 | 99.99 | |
| 9 | 92899 | 4.5 | 4.51 | 99.99 |
TABLE 3: ROBUSTNESS
| Parameter | Mean retention time | Mean area | % RSD |
| Change in detection wave length (nm) | |||
| 237 | 2.09 | 61488.6 | 0.0095 |
| 241 | 2.09 | 61586.6 | 0.0080 |
| 245 | 2.09 | 61738.6 | 0.0195 |
| Change in flow rate (ml/min) | |||
| 0.9 | 2.0736 | 55435 | 0.0075 |
| 1.0 | 2.0946 | 61594 | 0.0048 |
| 1.1 | 2.1254 | 67755 | 0.0055 |
TABLE 4: LOD AND LOQ:
| Name of the drug | Slope | SD | LOD | LOQ |
| Catechins | 20591 | 55.172 | 0.0088 µg/ml | 0.0267 µg/ml |
| Acceptability | < 3.0 | < 10 |
CONCLUSION: The method initiated with methanol extract, isolation, and phytochemical screening and thereby HPLC method development. The instruments and chemicals used for the purpose are calibrated and fine graded suitable for the analysis through HPLC.
The method developed is validated as per the ICH guidelines of Q2R1 for its system suitability, linearity, precision, accuracy, sensitivity, and robustness to meet the academic and industrial needs.
ACKNOWLEDGEMENT: Special thanks to Santhiram College of Pharmacy for providing all facilities in the laboratories for the new analytical method development for the estimation of catechins in B. ciliata by RP-HPLC method.
AUTHORS CONTRIBUTION: I am grateful to Dr. C. Madhusudhan Chetty in encountering the problems in relation to this work, and my supporter Mr. N. Madan Gopal played and continued the experiment at late hours of his duty. Students K. Sushmita has great in collecting the literature and extraction of the plant materials successfully.
CONFLICTS OF INTEREST: Nil
REFERENCES:
- Gurav SS: A comprehensive review: Berginia ligulata wall-A controversial clinical candidate. International Journal of Pharmaceutical Science and Research 2014; 5(5): 1630-42.
- Ruby KM, Dwivedi J and Chauhan R: Berginia ciliata mine of medicinal properties; a review. International Journal of Pharmaceutical Sciences 2012; 15(2): 20-23.
- Hagerman ANNE: Extraction of tannins from fresh and preserved leaves. Journal of Chemical Ecology 1998; 14(2).
- Gangwal A: Extraction and estimation and TLC of tannins: a review. International Journal of Pharmaceutical Sciences 2013; 2(3): 1585-88.
- Durgawale TP, Durgawale PP and Khanwelkar CC: Quantitative estimation of tannins by HPLC. Scholars Research Library 2016; 8(3): 123-26.
- Chavan U D and Amarowicz R: Effect of various solvent systems on extraction of phenolics tannins and sugars from beach pea. International Food Research Journal 2013; 20(3): 1139-44.
- Zohara SF, Meriem B, Samira S and Muneer MSA: Phytochemical screening and identification of some compounds from Mallow 2012; 2(4): 512-16.
- Srivastava N, Srivastava A and Srivastava S: Simultaneous quantification of berginin, epicatechin, (+) - catechin, and gallic in Bergenia ciliata using HPLC. Journal of Liquid Chromatography and Related Data 2015; 38: 1207-12.
- Rawat AKS, Singh DP, Srivastava SK and Govindarajan R: HPLC determination of bergenin in different Bergenia species. ACTA Chromatographia 2007; 19: 246-52.
- Jingyuanwen, Danhuili, Nataly and Marizlini: Development of an isocratic HPLC method for catechin quantification and its application to formulation studies, Elesvier 2012; 83: 1267-7.
- Felinger A, Boros B and Jakabova S: Validated HPLC method for simultaneously quantification of bergenin, arbutin, and gallic acid in leaves of different Bergenia species. Springer Plus 2014; 77(17-18): 1129-35.
- Shankhan M, Khan W and Singh WAM: Berginin determination in different extracts by HPLC densiometry. Journal of Pharmacy and Bioallied Sciences 2015; 7(4): 272-74.
- Gupta SP and Gang G: Quantitative estimation of gallic acid and tannic acid in Bhuvnesvara vati by RP-HPLC. Scholars Research Library 2014; 6(2): 31-36.
- Madhavi GP, Vishal P and Rakesh KP: Development and Validation of Improved RP-HPLC method for identification and estimation of ellagic acid and gallic acid in triphala churna. International Journal of Chem Tech Research 2010; 2(3): 1486-93.
- Ganjage PJ, Tapkir AS and Nipanikar SU: Pawar, Development and validation of a RP-HPLC method for the determination of ellagic acid in Terminalia bellirica extract and single herb capsule of Terminalia bellirica. International Journal of Pharmaceutical Education and Research 2018; 52(4): S56-S62.
- Sanghavi N, Bhosale SD and Malode Y: RP-HPLC method development and validation of quercetin isolated from the plant Tridax procumbence Journal of Scientific and Innovative Research 2014; 3(6): 594-97.
- Klein T, Longhini R and Mello JCPD: Development of an analytical method using RP-HPLC-PDA for a semi purified extract of Paullinia cupana Sorbilis. Elsevier 2012; 502-06.
How to cite this article:
Saradhi NDVR, Gopal NM, Chetty CM and Sushmitha K: Phyotochemical screening, analytical method development and validation for the determination of Catechins in B. ciliata by RP-HPLC. Int J Pharmacognosy 2019; 6(11): 360-64. doi link: http://dx.doi.org/10.13040/ IJPSR.0975-8232.IJP.6(11).360-64.
This Journal licensed under a Creative Commons Attribution-Non-commercial-Share Alike 3.0 Unported License.
Article Information
3
360-364
423
1273
English
IJP
N. D. V. R. Saradhi *, N. M. Gopal, C. M. Chetty and K. Sushmitha
Santhiram College of Pharmacy, Nerawada, Kurnool, Andhra Pradesh, India.
saradhi2u@gmail.com
30 October 2019
25 November 2019
27 November 2019
10.13040/IJPSR.0975-8232.IJP.6(11).360-64
30 November 2019