


BIOANALYTICAL METHOD DEVELOPMENT AND VALIDATION OF QUININE IN HUMAN PLASMA BY LC-MS
HTML Full TextBIOANALYTICAL METHOD DEVELOPMENT AND VALIDATION OF QUININE IN HUMAN PLASMA BY LC-MS
Raman R. Chandak * and Vedant Mahajan
Department of Pharmacognosy, School of Pharmacy, GH Raisoni University, Saikheda, Madhya Pradesh, India.
ABSTRACT: To develop a simple, specific, sensitive and robust bioanalytical method for determining Quinine in the human plasma with the help of LC-MS/MS API2000 various found parameters. Different Equipment experiment was found within the acceptance criteria, Different Column experiment was found within the acceptance criteria, and the Proposed Bioanalytical method for quantifying Quinine from K3EDTA based Human plasma was satisfactorily validated. It can be used to quantify Quinine from K3EDTA-based Human Plasma in Bioequivalence and Bioavailability Study.
Keywords: Quinine, LC-MS, Human plasma, Bioanalytical
INTRODUCTION: The reliability of analytical findings is important in forensic and clinical toxicology, as its off-course is a precondition for the correct construal of toxicological findings. This is especially true in the context of quality management and accreditation. Selective and sensitive analytical methods and bioanalytical methods for the quantitative and qualitative evaluation of drugs and their metabolites (analytes) are critical for the successful conduct of preclinical and/or biopharmaceutics and clinical pharmacology studies. The first studies measuring drugs in biological fluids were carried out to determine possible overdosing as part of the new science of forensic medicine/toxicology. Some techniques commonly used in bioanalytical studies include. Quinine is a natural white crystalline alkaloid having antipyretic (fever reducing), antimalarial, analgesic (painkilling), anti-inflammatory properties it is a well-known bitter antimalarial drug occurring among the alkaloids of cinchona bark and Ramijia. Cinchona bark contains about thirty alkaloids, but its antimalarial activity is mainly due to quinine, quinidine, cinchonine and cinchonidine; the theorized mechanism of action for quinine and related anti-malarial drugs is that these drugs are toxic to the malaria parasite. Specifically, the drugs interfere with the parasite's ability to break down and digest haemoglobin. Consequently, the parasite starves and/or builds up toxic
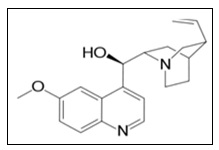
Structure:
Method Development: Liquid Chromatography coupled with tandem quadrupole mass spectrometry operated in multiple reactions monitoring (MRM) mode has been found as a very sensitive technique for determination as well as quantitation of drugs and their metabolites in biological matrix which is very much useful in pharmacokinetic studies.
Determination of Parent Ion: The parent ion for the respective analytes had been determined by AB SCIEX triple quadrupole mass spectrometer API 2000. The instrument was equipped with software ‘Analyst 1.4.2’ which had been used for subsequent quantitation and other relevant calculations. For Q1 scanning of the analytes, a long mass range (100-400) was selected.
Optimization of MRM Transitions: The parent ion breaks into several fragments on application of collision energy. The optimum collision energy was selected by studying the change of pattern in intensity of ionization of parent ion i.e. the intensity of daughter ion increased by increasing collision energy with proportionate decrease in parent ion intensity. The other compound-dependant parameters liked clustering potential (DP), Entrance potential (EP), Focusing potential (FP), Collision cell Entrance potential (CEP), Collision cell exit potential (CXP) were optimized similarly by varying simply and studying the change of the intensities of parent and daughter ion peaks
Finalizing the MS/MS Method Development: After getting all the optimized parameters, a multiple reaction monitoring (MRM) mode was built to create MS/MS method for the determination and subsequent quantitation of Quinine in biological matrix (i.e. plasma) along with Quinine D3 using as internal standard.
MRM Transition for Quinine D3 (Q1):
Optimized MRM Transition: Optimized MRM transitions and compound dependent and source dependant parameters for the Quinine and Quinine D3.
Optimized MRM Transitions and Parameters for Quinine and Quinine D3:
| MS Transition | Quinine | Quinine D3 |
| Ql | 325 amu | 328.20 amu |
| Q3 | 160 amu | 163.20 amu |
| Compound Dependant Parameters | ||
| Polarity | +ve | +ve |
| DP (Volts) | 80.00 | 80.00 |
| FP (Volts) | 58.00 | 80.00 |
| EP (Volts) | 10.00 | 10.00 |
| CEP (Volts) | 25.00 | 16.72 |
| CE (Volts) | 51.00 | 47.00 |
| CXP (Volts) | 16.00 | 16.60 |
| Dwell time (msec) | 200.00 | 200.00 |
| Source Dependant parameters | |
| CUR | 20.00 |
| IS | 3000.00 |
| Tem(‘c) | 350.00 |
| Gsl | 40.00 |
| Gs2 | 60.00 |
| ihe | ON |
| CAD | 6.00 |
Development of Liquid Chromatographic Method: The process of bioanalysis in a regulated environment involves the development of a highly sensitive MS/MS assay to detect an analyte in the low nanogram to pictogram level. Critical to the success of this assay is the separation of Quinine from the internal standard used as well as endogeneous materials present in plasma, such as phospholipids and other exogeneous metabolites from the analytes. Rigorous demands are placed on developing LC method to detect and quantify Quinine in a biological matrix. Criteria that the method must include: accuracy, precision, specificity, detection limit, quantitation limit, linearity, range, robustness. A method development strategy that is systemic in its approach can greatly simplify the process and allow the development optimal conditions quickly and efficiently.
Optimization of Chromatographic Condition: C18 and C8 are columns used during LC Method development. A column that can be operated over a wide range of pH (pH 2 to pH 8) is suitable for experimentation with concentration, strength, and ratio of various types of mobile phases consisting of organic solvent and buffers while providing sufficient resolution, sensitivity and response for Quinine. Using a shorter column enabled the analyst to achieve faster separation for the analyte. Since, the drug was non-polar, C18 column was preferred for separating dug from the plasma matrix because C8 column was showing poor resolution. There was no other interfering peak around the retention time 1.90 min of Quinine.
Optimization of a Mobile Phase: LC-MS/MS system requires a mobile phase containing volatile component. Mobile phase composition was altered using buffer solution in different proportions of varying pH with mobile phase. Electro-spray ionization is more efficient with a higher organic modifier concentration in mobile phase. A mobile phase was developed using acetonitrile as an organic solvent. Acetonitrile has higher eluting power than methanol; methanol is more polar than acetonitrile in reversed phase chromatography; the objective of this study was to develop a simple reliable method that would facilitate analysis of Quinine in human body fluid in large number of samples over a relatively short period of time. In cost-effective manner the suitability of mobile phase with 90% acetonitrile as organic modifier was investigated. The presence of a buffer solution in mobile phase is essential to achieve a peak of good resolution along with better sensitivity in reverse-phase chromatography.
Optimization of Sample Extraction Procedure: Adequate sample preparation is a key aspect of quantitative bioanalysis and can often cause bottlenecks during high-throughput analysis. Achievement of cleanliness in the extracted sample i.e. free from endogeneous as well as exogeneous interferences, gives assurance on long-term stability of the assay involving biological matrix performance. Four main principles of sample extraction are applied in general LC: Precipitation by addition of organic solvents, inorganic acids and/or chaotropic salts, protein filtration, Liquid –Liquid extraction (LLE), and Solid phase extraction (SPE).
RESULTS AND DISCUSSION:
System Suitability: The system suitability experiment was performed before the analytical day, and % RSD of area ratio of analyte to IS for MQC samples and signal to noise ratio (S/N) ratio for LLOQ sample was found within the acceptance criteria.
System Suitability Experiments and Signal-to-Noise (S/N) ratio for LLOQ:
| Equipment ID | Batch ID | %RSD of area ratio of analyte to IS for MQC samples | Signal to Noise (S/N) ration for LLOQ sample |
| INS/ANA/01 | SST01 | 1.44 | 627.64 |
| INS/ANA/01 | SST02 | 2.37 | 438.11 |
| INS/ANA/01 | SST03 | 2.37 | 438.11 |
| INS/ANA/01 | SST04 | 1.01 | 253.66 |
| INS/ANA/01 | SST05 | 0.37 | 442.35 |
| INS/ANA/02 | SST06 | 1.81 | 456.85 |
| INS/ANA/01 | SST07 | 1.03 | 551.25 |
| INS/ANA/02 | SST08 | 1.47 | 658.24 |
| INS/ANA/01 | SST09 | 1.80 | 653.48 |
| INS/ANA/01 | SST10 | 2.36 | 94.32 |
| INS/ANA/01 | SST11 | 1.23 | 163.55 |
| INS/ANA/01 | SST12 | 1.32 | 248.39 |
| INS/ANA/02 | SST13 | 1.94 | 99.23 |
| INS/ANA/01 | SST14 | 0.94 | 443.39 |
Autosampler Carryover Test: The Autosampler carryover test was performed, and no % carryover was observed in blank samples.
| S. no. | Auto sampler carryover Test samples | Area observed at RT of Analyte | % Carryover of Analyte | Area observed of RT of IS | % Carryover of IS |
| Aqueous (AQ) | |||||
| 1 | MP | 0 | 0 | ||
| 2 | AQSTD H | 387656 | 0.00 | 235665 | |
| 3 | MP | 0 | 0 | 0.00 | |
| 4 | AQ STD | 6692 | 313131 | ||
| Extracted | |||||
| 5 | BLK | 385890 | 0.00 | 0 | 0.00 |
| 6 | STD H | 0 | 238666 | ||
| 7 | BLK | 5938 | 0 | ||
| 8 | STD A | 281445 |
Selectivity and Specificity:
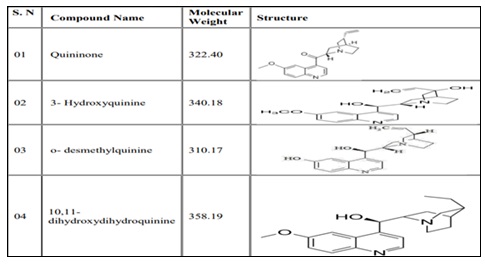
Information about Metabolites: Reference: Label Information QUALAQUIN, NDA no. 021799, USFDA Reference ID: 3535706, Quinine is metabolized almost exclusively via hepatic oxidation cytochrome P 450 (Cyo) pathways, resulting in four primary metabolites, 3- Hydroxyquinine, 2- Quinone, Odesmethylquinine. and 10, 11- dihydroxydihydroquinine. The molecular weight and structure of Quinine and its metabolites are given
Molecular Weight and Structure of Quinine Metabolites: From the tablet it is evident that the molecular weight of metabolites is very much different from Quinine, so none of the metabolites can have MRM of Quinine in the current method of Quantification, MRM used for Quinine was 325/160.0 amu in positive polarity mode.
Due to the specific MRM of MRM of Quinine, these metabolites cannot be detected in the current method hence it can be concluded that analytical method used for the determination of Quinine in human plasma with K3EDTA is selective.
| S. no. | Sample ID | Type of Biological MatriX | Area at RT of Analyte | % Interference of Analyte | Area at RT of Is | % Interference of IS |
| 1 | BLK01 | 0 | 0 | |||
| 2 | LLOQ01 | 6165 | 0.00 | 279733 | 0.00 | |
| 3 | BLK02 | 0 | 0 | |||
| 4 | LLOQ02 | 6708 | 0.00 | 309451 | 0.00 | |
| 5 | BLK03 | 0 | 0 | |||
| 6 | LLOQ03 | Normal Plasma | 6549 | 0.00 | 307911 | 0.00 |
| 7 | BLK04 | 0 | 0 | |||
| 8 | LLOQ04 | 7263 | 0.00 | 314786 | 0.00 | |
| 9 | BLK05 | 0 | 0 | |||
| 10 | LLOQ05 | 8494 | 0.00 | 338108 | 0.00 | |
| 11 | BLK06 | 0 | 0 | |||
| 12 | LLOQ06 | 6200 | 0.00 | 289133 | 0.00 | |
| 13 | BLK07 | Haemolyzed Plasma | 0 | 0 | ||
| 14 | LLOQ07 | 5854 | 0.00 | 271219 | 0.00 | |
| 15 | BLK08 | Lipemic Plasma | 0 | 0 | ||
| 16 | LLOQ08 | 5303 | 0.00 | 261850 | 0.00 |
Quantification of Quality Control Sample: Quantitation of Quinine was not affected due to concomitant medication in Quality control samples.
Concomitant Medication Experiment– Quantification of Quality Control Samples:
| Sample ID | LQC | HQC |
| Nominal concentration (ng/mL) | 202.10 | 4021.89 |
| Acceptable Limit(ng/mL) | 171.79 to 232.42 | 3418.61 to 4625.17 |
| S. no. | Back calculated concentration | (ng/mL) |
| 1 | 195.23 | 3989.96 |
| 2 | 191.91 | 4092.46 |
| 3 | 187.39 | 4066.34 |
| 4 | 188.21 | 4064.57 |
| 5 | 197.33 | 4215.27 |
| 6 | 191.06 | 3953.28 |
| Mean | 191.86 | 4063.65 |
| SD | 3.8788 | 91.0368 |
| %RSD | 2.02 | 2.24 |
| % Nominal | 94.93 | 101.04 |
SUMMARY AND CONCLUSION:
| Parameters | Criteria | Limit | Results |
| System Suitability | % RSD of area ratio of Analyte to IS for six consecutive injections for MQC samples | NMT 5.00% | 0.37 to 2.37 |
| Autosampler Carryover Test | Suppose any peak is present at the retention time of Analyte in Mobile phase injection or Blank sample. In that case, its area response should be < 20.00 % of area response of an Aqueous STD A (LLOQ) or Extracted STD A (LLOQ) respectively. If any peak is present at the retention time of an IS in Mobile phase injection or Blank sample, its area response should be < 5.00% of area response of an Aqueous STD A (LLOQ) or Extracted STD A (LLOQ) respectively | 1. If any peak is present at the retention time of Analyte in Mobile phase injection or Blank sample, its area response should be < 20.00 % of area response of an Aqueous STD A (LLOQ) or Extracted STD A (LLOQ) respectively. 2. If any peak is present at the retention time of an IS in Mobile phase injection or Blank sample, its area response should be < 5.00% of area response of an Aqueous STD A (LLOQ) or Extracted STD A (LLOQ) respectively | Complies |
| Selectivity | Response of an interfering peak at the retention time of Analyte should be < 20.00% of respective LLOQ and response of interfering peak in blank at the retention time of IS should be 5.00 % of the response of IS in LLOQ | Response of an interfering peak at the retention time of Analyte should be < 20.00% of respective LLOQ and response of interfering peak in blank at the retention time of IS should be< 5.00 % of the response of IS in LLOQ | Complies |
| Haemolysis Effect | % RSD | ||
| LQC | NMT 15.00% | 3.44 | |
| HQC | 1.56 | ||
| % Nominal | |||
| LQC | 85.00% to 115.00% | 92.86 | |
| HQC | 95.02 | ||
| % RSD | |||
| Lipemic Effect | LQC | NMT 15.00% | 2.44 |
| HQC | 1.28 | ||
| % Nominal | |||
| LQC | NMT 15.00% | 90.43 | |
| HQC | 93.89 | ||
| Matrix Factor | %RSD | ||
| LQC | NMT 15.00% | 3.18 | |
| HQC | 1.67 | ||
| Concomitant Medication Experiment | Response of an interfering peak at the retention time of Analyte should be < 20.00% of respective LLOQ and response of interfering peak at the retention time of IS should be< 5.00% of the response of IS. | Response of an interfering peak at the retention time of Analyte should be < 20.00% of respective LI,OQ and response of interfering peak at the retention time of IS should be < 5.00% of the response of IS | Complies |
| % Nominal | |||
| LQC | 94.93 | ||
| HQC | 85.00% to 115.00% | 101.04 | |
| %RSD | |||
| Concomitant Medication Experiment (Quantification of Quality Control samples | LQC | NMT15.00% | 2.02 |
| HQC | 2.2 | ||
| Correlation Coefficient | >0.99 | 0.9988 to 0.9999 | |
| Calibration Curve | % Nominal at LLOQ level | 80.00% to 120.00% | 98.55 |
| % Nominal at levels other than LLOQ level | 85.00% to 115.00% | 98.38 to 103.31 |
ACKNOWLEDGMENT: Nil
CONFLICT OF INTEREST: Nil
REFERENCES:
- Kasture V, Wadodkar SG, Mahadik KR and More HN: Textbook of Pharmaceutical Analysis – II, 17th edn, Nirali Prakashan 2007; 4-9.
- Sethi PD: HPLC: Quantitative Analysis of Pharmaceutical Formulations. CBS Publishers and Distributors, New Delhi 1996; 3-35.
- Snyder LR, Kirkland JJ and Glajch JL: Practical HPLC Method Development, John Wiley and Sons, New York 1997.
- Katz E, Eksteen R, Schoenmakers P and Miller N: Chromatographic Science Series, handbook of HPLC, 1998; 78: 293.
- Sethi PD: HPLC: Quantitative analysis of pharmaceutical formulations, CBS Publication and Distributors, New Delhi 2001; 101-105.
- Remington - The Science and Practice of Pharmacy, 21st edn, 2005; 1: 615-626.
- Sethi PD: HPTLC: Quantitative Analysis of Pharmaceutical Formulations, CBS Publishers and Distributors, New Delhi 1996; 1-28.
- Kealey D and Haines PJ: Instant notes of Analytical Chemistry 2002; 5.
- Conners KA: A Textbook of Pharmaceutical Analysis, 3rd edn, A Wiley-Intersciences Publication 1999; 173-189.
- Beckett AH and Stenlake JB: Practical Pharmaceutical Chemistry, 4th edn, Part II, CBS Publishers and Distributors, New Delhi 1997; 275-277.
- Willard HH, Merritt LL, Dean JA and Settle FA: Instrumental Methods of Analysis, 7th edn, CBS Publisher and Distributors, New Delhi 1986; 170-178.
- Kasture AV, Wadodkar SG, Mahadik KR and More HN: Textbook of Pharmaceutical Analysis – II, 17th edn, Nirali Prakashan 2007; 1: 156-164.
- Sharma BK: Instrumental Methods of Chemical Analysis, 21thedn, Goel Publishing House, Krishna Prakashan Ltd., 2002; 42-43.
- Thompson M, Ellison SLR and Wood R: Harmonized Guidelines for Single Laboratory Validation of Method of Analysis. Pure Appl Chem 2008; 74: 835–55.
- Wood R: How to Validate Analytical Methods. Trends Analyt Chem 2005; 18: 624–132.
- McDowall RD: The Role of Laboratory Information 147 Management Systems LIMS in Analytical Method Validation. AnalChim Acta 2007; 54: 149–58.
- Vander HY, Nijhuis A, Verbeke JS, Vandeginste BG and Massart DL: Guidance forrubustness/ruggedness test in method validation. J Pharm Biomed Anal 2009; 24: 723–53.
- Puluido A, Ruusanches I, Boque R and Rius FX: Uncertainty of results in routine Qualitative Analysis in Analytical Chemistry. J Pharm Biomed Anal 2005; 22: 647–54.
- Kallner A. Quality specification based on the uncertainty of measurement. Scand J Lab Invest 2005; 59: 513–6.
- Jhanf J, Chang CC, Fink DJ and Kroll MH: Evaluation of linearity in clinical Laboratory.20. Arch Pathol Lab Med 2004; 128: 44–8. [PubMed: 14692813]
- Mark H: Application of improved procedure for testing linearity of analytical method to pharmaceutical analysis’ Pharm Biomed Anal 2003; 33: 7–20.
- Valcarcel M, Cardenas S and Gallego M: Sample Screening system in analytical chemistry. Trends Analyt Chem 1999; 23: 137–45.
- Ye C, Liu J, Ren F and Okafo N: Design of Experimental Date Analysis by JMP (SAS Institute) in Analytical Method Validation. J Pharm Biomed Anal 2000; 23: 581–9. [PubMed: 10933552]
- Nowatzke W and Woolf E: Best practices during bioanalytical method validation for the characterization of assay reagents and the evaluation of analyte stability in assay 25. Standards, quality controls, and study samples. AAPS J 2007; 9: 117–22.
- [PMCID: PMC2751400] [PubMed: 17614353]
- Braggio S, Barnaby RJ, Grosi P and Cugola A: strategy for validation of bioanalytical methods. J Pharm Biomed Anal 1996; 14: 375–88. [PubMed: 8729635]
- James CA, Breda M and Frigerio E: Bioanalytical method validation: A riskbased approach. J Pharm Biomed Anal 2004; 35: 887–9. [PubMed: 15193733]
How to cite this article:
Chandak RR and Mahajan V: Bioanalytical method development and validation of quinine in human plasma by LC-MS. Int J Pharmacognosy 2023; 10(7): 405-11. doi link: http://dx.doi.org/10.13040/IJPSR.0975-8232.IJP.10(7).405-11.
This Journal licensed under a Creative Commons Attribution-Non-commercial-Share Alike 3.0 Unported License.
Article Information
11
405-411
616 KB
1182
English
IJP
Raman R. Chandak * and Vedant Mahajan
Department of Pharmacognosy, School of Pharmacy, GH Raisoni University, Saikheda, Madhya Pradesh, India.
ramanchandak29@gmail.com
18 July 2023
25 July 2023
26 July 2023
10.13040/IJPSR.0975-8232.IJP.10(7).405-11
31 July 2023