


APPLICATION OF MOLECULAR BEACON BASED BIOSENSOR AGAINST rs699 SNP IN HYPERTENSIVE AND NON- HYPERTENSIVE PUNJABI POPULATION
HTML Full TextAPPLICATION OF MOLECULAR BEACON BASED BIOSENSOR AGAINST rs699 SNP IN HYPERTENSIVE AND NON- HYPERTENSIVE PUNJABI POPULATION
Neelam Verma * 1, Navpreet Kaur 1 and Pawan Krishan 2
Department of Biotechnology 1, Department of Pharmaceutical Sciences and Drug Research 2, Punjabi University, Patiala - 142001, Punjab, India.
ABSTRACT: Molecular beacons have shown their topnotch potential in a variety of basic research, biomedical detection and clinical diagnosis. Their excellent selectivity, sensitivity, detection without separation have made them widely accepted tool for nucleic acid analysis. MBs present high-throughput screening of SNPs. The use of SNPs in the detection of genetic disorders is facilitated by the recent discovery of more than 4 million SNPs in the human genome. The objective of this study was to explore the association of rs699 SNP with essential hypertension in Punjabi Population. MB based biosensor developed by Verma et al., in 2016 was chosen for analysis. These hypertensive subjects tested positive against hypertensive biosensor (against allele C) were associated with essential hypertension. C4072T or rs699 polymorphism was genotyped in 50 hypertensive and 50 normotensive subjects. The p-value for the C allele in hypertensive patients was 0.71, which concludes susceptibility to hypertension in this population when the CC genotype is present. The implementation was cross-validated by applying the same samples to Normotensive Biosensor (against T allele). The presence of fluorescence with hypertensive biosensor confirms the presence of a mutation in hypertensive patients or patients that are clinically naive but can develop hypertension in the forthcoming due to hypertensive allele presence. Hence it can help in the future pharmacogenetic based treatment of patients.
| Keywords: |
Molecular Beacon Biosensor, rs699 SNP, Hypertensive Biosensor, Normotensive Biosensor Punjabi Population
INTRODUCTION: Molecular Beacons (MBs) are single-stranded nucleic acid probes which are composed of three different functional domains: a stem, a loop, and a fluorophore/quencher pair 1 - 4. The fluorophore/quencher pair is the signaling unit that produces the on / off signals as per the conformation state of MBs.
MBs open up only when perfectly matched target sequences are present, thus strongly discriminating even at the single base pair mismatch 5. Opening up of MB upon hybridization to the target relays the fluorescence signal and hence can be used for SNP detection 1 - 3.
Various conventional techniques such as RFLP (Restriction Fragment Length Polymorphism), AFLP (Amplified Fragment Length Polymorphism), and SSR (Single Sequence Repeat) was used for SNP analysis. The development of high throughput techniques such as Taqman probes Amplifluor, Genome resequencing, SNP-arrays, MALDI-TOF, allele-specific PCR, etc. not only helped in reaction speed but also with large sample size. These techniques have a high economic cost. MBs on contrary present many advantages such as ease of synthesis, molecular specificity, unique functionality, structural tolerance to various modifications and inherent signal transduction mechanism. Also, the reusability of MBs when immobilized lowers the economic cost, thus aiding in the development of MB based SNP arrays. They can differentiate between even single mismatch nucleotide due to their unique thermodynamic and structural properties, thus providing them a high degree of molecular specificity in SNP detection. MBs can be used in conjunction with amplified target DNA and simultaneously detect amplified products in real-time PCR. One of the most potent applications is that it is not necessary to isolate the probe-target hybrids as non-hybridized MBs do not fluoresce 6. SNPs are variations present in 1% population and are randomly distributed throughout the genome contributing to our uniqueness.
An SNP in a protein-coding sequence induces amino acid change, thus leads to functional changes in the protein. Some of these variations are directly linked to human diseases. These genetic differences can be medically relevant, which are not only health conquering, but also descends into our progeny. SNPs are useful markers for human genetic studies because of their high density throughout human genome 7. Moreover, they make it easy to perform large-scale genetic analysis by high-throughput techniques 8.
Furthermore, the occurrence of SNPs in the coding region (coding SNP; cSNP) and promoter region (regulatory SNP; rSNP) of genes cannot only alter protein function but also gene expression 9, 10. Various diseases such as autoimmune diseases, genetic diseases, cancers, neurodegenerative diseases, cardiovascular diseases have been linked to SNPs. Hypertension is one of the cardiovascular diseases that tops the chart because of modern lifestyle as it hits 25% of the adult population. Genetics of hypertension is complex, and here multiple genes interact and react to different environmental stimuli. Various studies have confirmed the presence of a biallelic and multiallelic polymorphism in genes responsible for hypertension 11 - 14. The risk of stroke is lowered by 40% if blood pressure is controlled.
Renin-angiotensin-aldosterone system (RAAS) controls the blood pressure, a system that includes kidney, cardiovascular system, lungs and central nervous system 15 - 18. AGT gene is one of the regulators of blood pressure. The AGT code for angiotensinogen peptide that is a precursor to angiotensin II where latter regulates BP by multiple mechanisms that include sodium retention in blood and its re-absorption in the kidney 15, 18, 19. One of the first-line agents for the treatment of hypertension are angiotensin-converting enzyme inhibitors (ACEI). These inhibitors block the active site of angiotensin-converting enzyme, thereby, decrease in angiotensin levels, hence lowering BP 19 Fig. 1.
However, the BP management response varies among an individual in different ethnic groups 20 - 22, that concludes the genetic constitution is the key in BP response to ACEI therapy. Pregenetic screening of presence disease-causing SNP, in particular, the ethnic group may help with pharmacogenetic analysis and thus recommend much-needed complimentary therapy. The molecular linkage of the angiotensinogen gene in human hypertension was first established in 1992 15. Until then, there have been various studies that linked AGT polymorphism to essential hypertension 15, 23 - 42. The various ethnic groups that were reported with mutated rs699 are Polish Population, Northern Han Chinese population, Older Australians, Female subjects in Japan, Mexican - mestizo women, Chinese Coronary patients, Japanese male workers 23 - 41.
Our present research is based on the application of pre-reported developed biosensor against rs699 SNP in Punjabi Population 42. rs699 is angiotensinogen SNP that encodes a functional change. This is known as M235T or C4072T. C allele instead of T encodes threonine in protein, which contributes to higher plasma angiotensin levels thus elevating blood pressure. The surface immobilized molecular beacons can distinguish a C/T mutation in gene sequence detected by G/C allele at 28th nucleotide position. C allele in a mutated sample of target oligonucleotides binds to the central position (28th) of the loop of the molecular beacon (G allele), and 3 fold enhancement of fluorescence was obtained 42. The working of Biosensor is shown in Fig. 2.
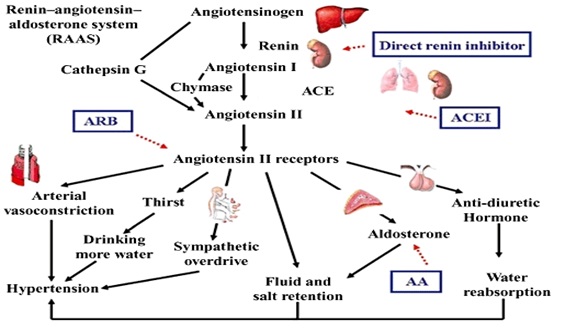
FIG. 1: RAAS. RENIN, PRODUCED BY THE JUXTAGLOMERULAR CELLS OF THE KIDNEY CONVERTS ANGIOTENSINOGEN TO A-I. ANGIOTENSINOGEN IS AN ALPHA-2-GLOBULIN MAINLY PRODUCED BY THE LIVER. A-I IS BIOLOGICALLY INACTIVE AND IS ACTIVATED BY ACE, MAINLY PRODUCED BY THE LUNGS TO FORM A-II. A-II ACTS ON A-II RECEPTORS. THE ANGIOTENSIN TYPE 1 (AT1) RECEPTOR GOVERNS MOST PHYSIOLOGICAL EFFECTS. THE NET EFFECTS OF ACTIVATION OF THE RAAS INCLUDE VASOCONSTRICTION, INCREASED ARTERIAL BLOOD PRESSURE, INCREASED MYOCARDIAL CONTRACTILITY, SODIUM AND WATER RETENTION WHICH SUBSEQUENTLY INCREASES. THE EFFECTIVE CIRCULATING VOLUME. RENIN-ANGIOTENSIN–ALDOSTERONE BLOCKADE CAN BE ACHIEVED BY DIRECT RENIN INHIBITOR, ACEI, ARB, AND AA. A-II CAN ALSO BE PRODUCED BY ALTERNATIVE PATHWAYS BY ENZYMES LIKE CHYMASE AND CATHEPSIN G, WHICH FORM THE BASIS OF ‘A-II ESCAPE.’ THIS IS ALSO THE RATIONALE FOR USING THE DUAL BLOCKADE OF THE SYSTEM BY ACEI AND ARB 19
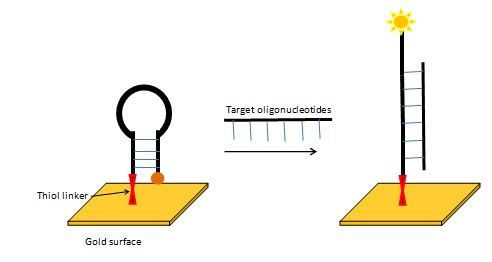
FIG. 2: HYBRIDIZATION OF MOLECULAR BEACON TO TARGET SEQUENCE 42
MATERIALS AND METHODS:
Chemicals: Hypertensive and non-hypertensive blood samples were procured from Muktsar and Patiala. PCR solutions of molecular grade were procured from Himedia technologies. The primers used for DNA amplification were procured from Regeneration Technologies, Chandigarh, India are shown in Table 1. Silicon wafer with gold-coated was procured from IIT Delhi, India. The oligonucleotides sequence of Molecular Beacons is shown in Table 2, purchased from Regeneration Technologies, Chandigarh, India. Molecular Beacons (MBs) were functionalized at 5’end with the thiol group and 3’end with Tetramethylrhodamine (TMR). All other chemicals used were of molecular biology grade, without any further purification. Ultrapure water with a resistivity of 18.2 MΩ as produced by the WaterPro water purification system (Labconco Corporation, Kansas City, MO) was used in the preparation of buffers and rinsing solution. The buffered saline used has a composition of 20 mM cacodylic acid, 0.5 M NaCl and 0.5 mM EDTA, pH = 7.
TABLE 1: FORWARD AND REVERSE PRIMER SEQUENCES USED IN PCR AMPLIFICATION
| 1 | Forward primer | 5’TGACAGGATGGAAGACTGGC-3’ |
| 2 | Reverse primer | 5’CTAAGTCCTAGGGCCAGAGC-3’ |
TABLE 2: MOLECULAR BEACON PROBES WITH THEIR SEQUENCE
| S. no. | Sequence Designation | Oligonucleotide Sequence |
| 1 | Molecular Beacon Sequence 1 (MB1) SNP | 5’-C-6-thiol- TGGAAGACTGTGTCCACACTGGCTCCCGTCAGGGAGCA GCCAGTCTTCCA-3’ Amino-C7-TMR-3’ |
| 2 | Molecular Beacon Sequence 2 (MB2) wild type | 5’-C-6-thiol- TGGAAGACTGTGTCCACACTGGCTCCCATCAGGGAGCAG CCAGTCTTCCA-3’ Amino-C7-TMR-3’ |
Methods:
Hypertensive Blood Samples: Blood samples were procured from the Muktsar district in Punjab, India. The patient consent contains the following data, the name of a patient, age, sex, blood pressure stats, hereditary of disease, and drug recommended. Ethical clearance for the procurement of blood samples from human subjects was obtained from the Institutional Ethics Committee (IEC) and file no. is 141/DLS/HG.
- 50 Hypertensive samples and 50 normotensive samples with less than 60 years and more than 20 years were selected.
- As per JNC, SBP was not less than 140 mmHg, and DBP was not less than 90 mmHg.
DNA Isolation, Qualification and Quantification: DNA was extracted from samples by salting out technique 43. Nucleic acid precipitation is used to purify and concentrate DNA. Precipitation is based upon the fact that DNA is less soluble in alcohol than in polar water. Ethanol is the most widely used alcohol for DNA purification.
The extracted DNA was analyzed on 1% agarose gel to view the genomic DNA. Genomic DNA was quantitatively analyzed on an opticalfiber spectrophotometer. All the 100 isolated genomic DNA samples were analyzed by measuring absorbance at wavelengths of 260, 280 and 320 nm. After UV quantification the concentration of DNA was calculated as below:
Conc. of DNA = OD260 X 50 μg/ml X DF
Where DF = Dilution Factor, OD260 of 1 = 50 μg of DNA/ml
PCR Amplification and Purification of Amplified Targets: PCR reaction was optimized at different concentrations of MgCl2 and range of temperature. One with best bands was selected for the amplification. The 125bp sequence from rs699 SNP (AGT gene) and an ancestral gene sequence was amplified via PCR by using primer pairs as listed in Table 1. Various chemicals used in reactions are summed up in Table 3, and Table 4 contains different phases of PCR Cycles where numbers of cycles were 35
TABLE 3: DIFFERENT COMPONENTS OF PCR REACTION MIXTURE
| S. no. | Contents | Optimum concentration range | Concentration used | Volume used (µl) |
| 1 | Template DNA | 1ng-1µg | In mg as per sample | 1 |
| 2 | Forward Primer | 0.05-1µM | 1µM | 1 |
| 3 | Reverse Primer | 0.05-1µM | 1µM | 1 |
| 4 | Buffer S | 10x | 1x | 2.5 |
| 5 | MgCl2 | 1.5- 4mM | 2mM | 1 |
| 6 | dNTPs | 200µM | 200µM | 2 |
| 7 | IP water | 16 | ||
| 8 | Taq polymerase | 0.125-2.5 units | 2.5 units | 0.5 |
TABLE 4: PCR PHASE FOR 25 µL SOLUTION
| S. no. | PCR Phases | Temperature | Time | No. of cycles |
| 1 | Initial Denaturation | 94 °C | 5 min | 01 |
| 2 | Denaturation | 94 °C | 45 sec | 35 |
| Annealing | 55.6 °C | 30 sec | ||
| Extension | 72 °C | 30 sec | ||
| 3 | Final extension | 72 °C | 10 min | 01 |
The total volume of reaction: 25 µl, Lid Temperature 105 °C, Hold at 4 °C forever.
Application of Amplified Targets to rs699 Based Biosensor:
Preparation of Self-assembled Oligonucleotides on Gold Surface: 42 Gold coated silicon wafers were cleaned with a piranha solution (4:1 concentrated H2SO4 / 30% H2O2) overnight at room temperature and then rinsed with ultra-pure water. The self - assembly process of hairpin oligonucleotides on the gold surface was done by pouring the mixture of hairpin oligonucleotides and 3-mercaptopropanol in a ratio of 1:1. After two hours the modified chip was thoroughly rinsed with hot water (90 ºC or higher) to remove any unbound oligonucleotides. Next, the gold chip carrying the mixed monolayer was immersed in buffered saline for hairpin formation. Hybridization with the target (amplified DNA) to the hairpin probes on the gold was performed at room temperature under the same conditions.
Determination of Fluorescence: Hybridization was analyzed at 35 °C using Mini Opticon, BioRad, USA, set with a 435 ± 5 nm excitation filter and a 556 ± 5 nm emission filter after 5 mins of hybridization.
Analysis of Population by Applying Hardy-Weinberg Law: The Hardy-Weinberg equation is a mathematical equation which is used to calculate the genetic variations of a population at equilibrium. It states the amount of genetic variation in a population will remain constant from one generation to the next in the absence of disturbing factors. The equation is given as:
p2 + 2pq + q2 = 1
Where p represents the "A" allele frequency and q is the frequency of the "a" allele in the population. Here in the equation, p2 is the frequency of the homozygous genotype AA, q2 is the frequency of the homozygous genotype aa, and 2pq is the frequency of the heterozygous genotype Aa. Also, the sum of the allele frequencies of all the alleles at the locus must be 1, so p + q = 1. If the p and q allele frequencies are known, then the frequencies of the three genotypes may be calculated using the Hardy-Weinberg equation.
RESULTS AND DISCUSSION:
Hypertensive Blood Samples: The blood samples procured from hypertensive and normotensive patients have the following statistics as presented in Table 5.
TABLE 5: SUMMARY OF PATIENT SAMPLES
| No. of Patients | 100 (Hypertensive subjects -50; Normal Subjects- 50) |
| Hypertensive Subjects (50) | Men -19;
Women- 31 |
| Normotensive Subjects (50) | Men-27;
Women-23 |
| Blood Pressure Statistics | Systolic-above 140mm of Hg
Diasystolic-above 130mm of Hg |
| Hereditary Occurrence | Yes, Men -14;
Women -23 |
| Therapies
Used |
Diuretics, Beta Blockers, ACEI, ARB |
| 1st choice of therapy | ACEI |
DNA Isolation, Qualification, and Quantification: The DNA extracted from blood samples was analyzed for the presence of intact genomic DNA, which was confirmed by its presence in wells of 1% agarose gel Fig. 3. The presence of lambda peak at 260 confirms purified DNA and hence less protein and RNA. The derived λ260 / λ280 for most of the samples lies in between 1.68 to 1.77.
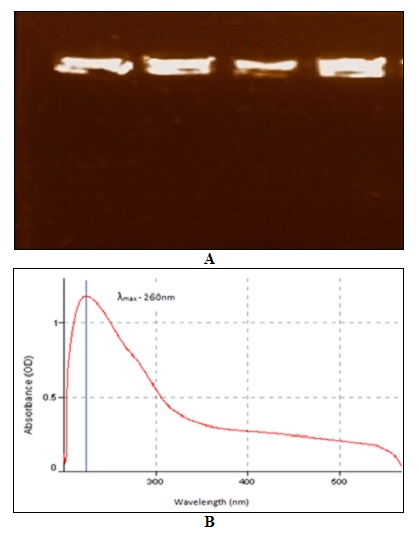
FIG. 3: A) INTACT GENOMIC DNA IN WELLS WITHOUT SHEERING. B) THE SCANNING SPECTRA FROM THE 200nm - 600nm
PCR Amplification and Purification of Amplified Targets: The amplified 125bp target sequence were analyzed on 10% polyacrylamide gel along with 100bp DNA ladder 44 and the bands were visualized via silver staining 45. The amplified 125bp bands are shown in Fig. 4.
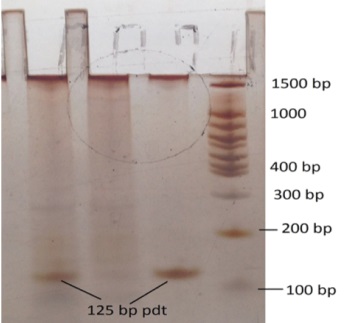
FIG. 4: 125BP AMPLIFIED BP PRODUCT VISUALIZED ON POLYACRYLAMIDE GEL
Application of Amplified Targets to rs699 Based Biosensor: The amplified 125bp target DNA was applied to immobilize MB onto gold chips (Hypertensive Biosensor). The fluorescence was observed in the presence of the SNP. Schematic illustration for MBs against SNP/Wild type sequence is depicted in Fig. 5. Amplified DNA from 50 hypertensive samples was applied to immobilized biosensor based on MB1 (Hypertensive Biosensor). As per the results, there should be an increment in fluorescence value since amplified PCR products are of hypertensive subjects. 38 samples (H1, H2, H6, H7, H8, H10, H11, H13, H16, H18, H19, H20, H21, H22, H25, H26, H27,
H28, H29, H30, H31, H32, H34, H35, H37, H38, H39, H40, H41, H42, H43, H44, H45, H46, H47, H48, H49, and H50) registered increment in fluorescence thus indicating mutation in rs699 leading to hypertension Table 6. While in others there was no increment in fluorescence hence indicating the absence of mutation rs699 but here hypertension may be present due to a mutation in any other gene hence leading to the condition.
For cross-validation, amplified, hypertensive samples were applied to the biosensor with immobilized MB2 (complementary to the wild-type gene of AGT gene sequence) or Normotensive Biosensor. The above-derived results were validated as PCR amplified products were applied to the biosensor as there should be no increment. 38 samples that fluoresced with MB1 based biosensor did not register increment here Table 7. The increment was registered in 20 samples (H2, H3, H4, H5, H8, H9, H10, H12, H14, H15, H16, H17, H23, H24, H31, H32, H33, H35, H36, and H39). These samples have wild-type rs699 SNP since the increment was registered against MB2. In these hypertensive subjects, the condition may prevail due to a mutation in some other gene than rs699.
Eight samples (H2, H8, H10, H16, H31, H32, H35 and H39) registered fluorescence enhancement with both Hypertensive and Normotensive Biosensor Table 6 and Table 7 indicating the presence of heterozygous gene with one wild-type allele and one mutated allele suggesting the clinical presence of hypertension is due to dominant expression of mutated gene due to environmental stimuli. For example, patients may have a high dietary salt intake which could elevate BP.
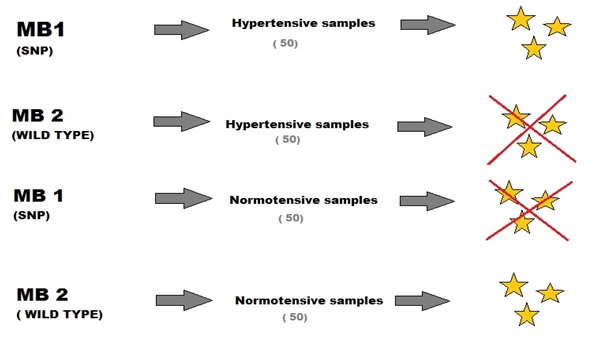
FIG. 5: SCHEMATIC ILLUSTRATION FOR MBS AGAINST SNP / WILD TYPE SEQUENCE IS DEPICTED
TABLE 6: FLUORESCENCE ENHANCEMENT IN HYPERTENSIVE SAMPLES AGAINST MB1 (HYPERTENSIVE BIOSENSOR)
| Sample no. | Before hybridization | After hybridization | Fluorescence enhancement |
| H1 | 0.404 ± 0.0024 | 0.627 ± 0.0005 | 1.55 ± 0.009 |
| H2 | 0.679 ± 0.0031 | 0.750 ± 0.003 | 1.10 ± 0.002 |
| H3 | 0.450 ± 0.004 | 0.313 ± 0.004 | 0.695± 0.003 |
| H4 | 0.652 ± 0.007 | 0.559 ± 0.003 | 0.85 ± 0.0064 |
| H5 | 0.267 ± 0.004 | 0.279 ± 0.005 | 1.04 ± 0.002 |
| H6 | 0.370 ± 0.002 | 0.724 ± 0.002 | 1.95 ± 0.0055 |
| H7 | 0.177 ± 0.005 | 0.386 ± 0.006 | 2.180 ± 0.028 |
| H8 | 0.240 ± 0.004 | 0.356 ± 0.004 | 1.48 ± 0.001 |
| H9 | 0.273 ± 0.006 | 0.283 ± 0.003 | 1.036 ± 0.0115 |
| H10 | 0.209 ± 0.003 | 0.264 ± 0.002 | 1.26 ± 0.01 |
| H11 | 0.336 ± 0.0057 | 0.429 ± 0.023 | 1.27 ± 0.05 |
| H12 | 0.592 ± 0.006 | 0.598 ± 0.04 | 1.01 ± 0.002 |
| H13 | 0.544 ± 0.007 | 1.26 ± 0.03 | 2.31 ± 0.025 |
| H14 | 0.233 ± 0.004 | 0.197 ± 0.04 | 0.84 ± 0.016 |
| H15 | 0.171 ± 0.003 | 0.173 ± 0.03 | 1.01 ± 0.15 |
| H16 | 0.769 ± 0.005 | 1.40 ± 0.002 | 1.82 ± 0.0057 |
| H17 | 0.667 ± 0.002 | 0.715 ± 0.005 | 1.07 ± 0.0057 |
| H18 | 0.305 ± 0.005 | 1.43 ± 0.005 | 4.68 ± 0.065 |
| H19 | 0.243 ± 0.003 | 0.489 ± 0.007 | 1.72 ± 0.16 |
| H20 | 0.205 ± 0.004 | 0.301 ± 0.003 | 1.46 ± 0.015 |
| H21 | 0.286 ± 0.006 | 0.498 ± 0.002 | 1.74 ± 0.03 |
| H22 | 0.308 ± 0.002 | 0.683 ± 0.03 | 2.22 ± 0.085 |
| H23 | 0.255 ± 0.005 | 0.232 ± 0.041 | 0.90 ± 0.143 |
| H24 | 0.145 ± 0.003 | 0.248 ± 0.0032 | 1.02 ± 0.005 |
| H25 | 0.300 ± 0.003 | 0.417 ± 0.0013 | 1.39 ± 0.0057 |
| H26 | 0.198 ± 0.00 | 0.334 ± 0.00 | 1.68 ± 0.0057 |
| H27 | 0.412 ± 0.00 | 0.578 ± 0.00 | 1.40 ± 0.0057 |
| H28 | 0.371 ± 0.032 | 0.474 ± 0.008 | 1.277 ± 0.089 |
| H29 | 0.347 ± 0.034 | 0.561 ± 0.004 | 1.61 ± 0.145 |
| H30 | 0.204 ± 0.02 | 0.298 ± 0.003 | 1.46 ± 0.13 |
| H31 | 0.331 ± 0.0035 | 1.648 ± 0.07 | 4.98 ± 0.17 |
| H32 | 0.191 ± 0.023 | 0.268 ± 0.0045 | 1.40 ± 0.082 |
| H33 | 0.203 ± 0.007 | 0.190 ± 0.005 | 0.94 ± 0.011 |
| H34 | 0.348 ± 0.0039 | 0.496 ± 0.003 | 1.43 ± 0.011 |
| H35 | 0.103 ± 0.003 | 0.166 ± 0.004 | 1.61 ± 0.01 |
| H36 | 0.161 ± 0.04 | 0.159 ± 0.004 | 1.00 ± 0.23 |
| H37 | 0.219 ± 0.076 | 0.332 ± 0.004 | 1.64 ± 0.59 |
| H38 | 0.217 ± 0.004 | 0.453 ± 0.004 | 2.08 ± 0.02 |
| H39 | 0.35 ± 0.004 | 0.391 ± 0.0056 | 1.18 ± 0.037 |
| H40 | 0.228 ± 0.006 | 0.352 ± 0.0076 | 1.54 ± 0.01 |
| H41 | 0.318 ± 0.003 | 0.395 ± 0.004 | 1.24 ± 0.0 |
| H42 | 0.210 ± 0.002 | 0.327 ± 0.005 | 1.55 ± 0.01 |
| H43 | 0.160 ± 0.004 | 0.218 ± 0.003 | 1.36 ± 0.015 |
| H44 | 0.172 ± 0.006 | 0.352 ± 0.07 | 2.04 ± 0.34 |
| H45 | 0.187 ± 0.003 | 0.247 ± 0.0025 | 1.32 ± 0.0057 |
| H46 | 0.181 ± 0.005 | 0.299 ± 0.006 | 1.65 ± 0.015 |
| H47 | 0.19 ± 0.004 | 0.647 ± 0.034 | 3.40 ± 0.15 |
| H48 | 0.158 ± 0.002 | 0.218 ± 0.005 | 1.38 ± 0.015 |
| H49 | 0.151 ± 0.004 | 0.667 ± 0.043 | 4.42 ± 0.17 |
| H50 | 0.180 ± 0.003 | 0.309 ± 0.0012 | 1.72 ± 0.02 |
TABLE 7: FLUORESCENCE ENHANCEMENT IN HYPERTENSIVE SAMPLES AGAINST MB1 (NORMOTENSIVE BIOSENSOR)
| Sample no. | Before hybridization | After hybridization (5min read) | Fluorescence enhancement |
| H1 | 0.253 ± 0.023 | 0.249 ± 0.003 | 0.98 ± 0.075 |
| H2 | 0.273 ± 0.004 | 0.312 ± 0.006 | 1.14 ± 0.005 |
| H3 | 0.466 ± 0.061 | 0.554 ± 0.004 | 1.18± 0.015 |
| H4 | 0.343 ± 0.0044 | 0.426 ± 0.003 | 1.24 ± 0.0057 |
| H5 | 0.240 ± 0.03 | 0.354 ± 0.0056 | 1.48 ± 0.160 |
| H6 | 0.264 ± 0.039 | 0.284 ± 0.0062 | 1.07 ± 0.14 |
| H7 | 0.250 ± 0.005 | 0.234 ± 0.0029 | 0.93 ± 0.01 |
| H8 | 0.190 ± 0.0074 | 0.234 ± 0.004 | 1.23 ± 0.025 |
| H9 | 0.213 ± 0.005 | 0.334 ± 0.004 | 1.57 ± 0.152 |
| H10 | 0.265 ± 0.003 | 0.292 ± 0.005 | 1.10 ± 0.0057 |
| H11 | 0.676 ± 0.01 | 0.723 ± 0.003 | 1.06 ± 0.015 |
| H12 | 0.258 ± 0.004 | 0.675 ± 0.005 | 2.62 ± 0.02 |
| H13 | 0.267 ± 0.007 | 0.284 ± 0.002 | 1.06 ± 0.02 |
| H14 | 0.257 ± 0.005 | 0.340 ± 0.005 | 1.32± 0.006 |
| H15 | 0.456 ± 0.003 | 0.559 ± 0.003 | 1.22 ± 0.0 |
| H16 | 0.677 ± 0.006 | 1.50 ± 0.004 | 2.22 ± 0.01 |
| H17 | 0.187 ± 0.004 | 0.277 ± 0.002 | 1.48± 0.02 |
| H18 | 0.301 ± 0.005 | 0.287 ± 0.005 | 0.95 ± 0.0 |
| H19 | 0.167 ± 0.004 | 0.182 ± 0.00 | 1.08 ± 0.025 |
| H20 | 0.210 ± 0.003 | 0.215 ± 0.006 | 1.02 ± 0.015 |
| H21 | 0.496 ± 0.002 | 0.350 ± 0.002 | 0.70 ± 0.0 |
| H22 | 0.225 ± 0.001 | 0.191 ± 0.006 | 0.84 ± 0.025 |
| H23 | 0.176 ± 0.006 | 0.250 ± 0.003 | 1.42 ± 0.03 |
| H24 | 0.143 ± 0.003 | 0.264 ± 0.004 | 1.86± 0.0057 |
| H25 | 0.180 ± 0.008 | 0.179 ± 0.006 | 0.99 ± 0.01 |
| H26 | 0.603 ± 0.003 | 0.561 ± 0.005 | 0.93 ± 0.0057 |
| H27 | 0.318 ± 0.004 | 0.345 ± 0.004 | 1.08 ± 0.0 |
| H28 | 0.406 ± 0.002 | 0.376 ± 0.002 | 0.92 ± 0.0 |
| H29 | 0.205 ± 0.004 | 0.185 ± 0.0045 | 0.90 ± 0.015 |
| H30 | 0.135 ± 0.003 | 0.145 ± 0.03 | 1.07 ± 0.195 |
| H31 | 0.875 ± 0.005 | 2.164 ± 0.06 | 2.47 ± 0.055 |
| H32 | 0.163 ± 0.002 | 0.188 ± 0.05 | 1.15± 0.29 |
| H33 | 0.299 ± 0.0034 | 0.386 ± 0.0045 | 1.29 ± 0.0 |
| H34 | 0.188 ± 0.005 | 0.204 ± 0.0067 | 1.08 ± 0.01 |
| H35 | 0.165 ± 0.0032 | 0.378 ± 0.0034 | 2.28 ± 0.025 |
| H36 | 0.95 ± 0.004 | 1.26 ± 0.0023 | 1.32 ± 0.002 |
| H37 | 1.00 ± 0.003 | 0.173 ± 0.0023 | 0.172 ± 0.001 |
| H38 | 0.677 ± 0.006 | 0.598 ± 0.0023 | 0.88 ± 0.004 |
| H39 | 0.397 ± 0.004 | 1.50 ± 0.002 | 3.77 ± 0.035 |
| H40 | 0.187 ± 0.007 | 0.177 ± 0.002 | 0.94 ± 0.025 |
| H41 | 0.198 ± 0.00 | 0.191 ± 0.001 | 0.95 ± 0.0057 |
| H42 | 0.178 ± 0.008 | 0.146 ± 0.004 | 0.81 ± 0.15 |
| H43 | 0.252 ± 0.004 | 0.201 ± 0.00 3 | 0.79± 0.0 |
| H44 | 0.393 ± 0.009 | 0.350 ± 0.004 | 0.89 ± 0.01 |
| H45 | 0.298 ± 0.003 | 0.271 ± 0.003 | 0.90 ± 0.0057 |
| H46 | 0.175 ± 0.004 | 0.165 ± 0.004 | 0.94 ± 0.0 |
| H47 | 0.225± 0.002 | 0.210 ± 0.005 | 0.92 ± 0.015 |
| H48 | 0.176 ± 0.004 | 0.191 ± 0.002 | 1.08 ± 0.01 |
| H49 | 0.143 ± 0.003 | 0.146 ± 0.004 | 1.01 ± 0.0057 |
| H50 | 0.180 ± 0.005 | 0.191 ± 0.003 | 1.05 ± 0.011 |
Application of Hypertensive Biosensor and Normotensive Biosensor on Normotensive Samples: PCR amplified normal samples (50) tested against Hypertensive Biosensor. Since they are non-complementary to each other, there should be no fluorescence increment in this analysis. But here 14 (N2, N3, N4, N5, N6, N7, N9, N10, N12, N15, N16, N24, N32, and N44) samples out of 50 registered fluorescence increment Table 8. These samples are clinically normotensive, but since rs699 SNP associated with hypertension is present, these patients in the future may have a higher risk of disease occurrence.
For cross-validation, normal samples were tested against Normotensive Biosensor (against the wild gene). Here 42 (N1, N6, N8, N11, N12, N13, N14, N15, N16, N17, N18, N19, N20, N21, N22, N23, N25, N26, N27, N28, N29, N30, N31, N32, N33, N34, N35, N36, N37, N38, N39, N40, N41, N42, N43, N44, N45, N46, N47, N48, N49 and N50) samples registered fluorescence enhancement thus validating biosensor cross results Table 9.
6 samples (N6, N12, N15, N16, N32, and N44) fluoresced with both Hypertensive Biosensor and Normotensive Biosensor, indicating these are heterozygous samples with both alleles. Since clinically hypertension does not persist in these samples, the expression of the mutant gene here masked by wild gene, but these patients could develop hypertension in the future when exposed to a certain environment which could trigger a gene Table 8 and Table 9.
TABLE 8: NORMAL SAMPLES AGAINST HYPERTENSIVE BIOSENSOR
| Sample no. | Before Hybridization | After Hybridization | Fluorescence enhancement |
| N1 | 0.362 ± 0.02 | 0.356 ± 0.0013 | 0.98 ± 0.05 |
| N2 | 0.240 ± 0.043 | 0.298 ± 0.02 | 1.25 ± 0.14 |
| N3 | 0.226 ± 0.04 | 0.342 ± 0.030 | 1.52 ± 0.14 |
| N4 | 0.147 ± 0.003 | 0.164 ± 0.002 | 1.11 ± 0.011 |
| N5 | 0.230 ± 0.003 | 0.308 ± 0.027 | 1.33 ± 0.1 |
| N6 | 0.210 ± 0.004 | 0.260 ± 0.0024 | 1.23 ± 0.0152 |
| N7 | 0.180 ± 0.004 | 0.222 ± 0.0056 | 1.23 ± 0.0057 |
| N8 | 0.136 ± 0.0034 | 0.137 ± 0.0023 | 1.00 ± 0.01 |
| N9 | 0.163 ± 0.0056 | 0.240 ± 0.0045 | 1.47 ± 0.02 |
| N10 | 0.414 ± 0.023 | 0.690 ± 0.0034 | 1.66 ± 0.085 |
| N11 | 0.312 ± 0.0045 | 0.307 ± 0.002 | 0.98 ± 0.01 |
| N12 | 0.230 ± 0.0034 | 0.288 ± 0.004 | 1.25 ± 0.0 |
| N13 | 0.184 ± 0.0034 | 0.192 ± 0.003 | 1.04 ± 0.0 |
| N14 | 0.165 ± 0.04 | 0.172 ± 0.004 | 1.07 ± 0.24 |
| N15 | 0.281 ± 0.006 | 0.453 ± 0.002 | 1.61± 0.03 |
| N16 | 0.246 ± 0.003 | 0.285 ± 0.0056 | 1.15 ± 0.01 |
| N17 | 0.186 ± 0.004 | 0.192 ± 0.003 | 1.02 ± 0.0057 |
| N18 | 0.178 ± 0.005 | 0.175 ± 0.004 | 0.97± 0.0057 |
| N19 | 0.193 ± 0.045 | 0.188 ± 0.003 | 1.0 ± 0.22 |
| N20 | 0.230 ± 0.003 | 0.244 ± 0.004 | 1.05± 0.01 |
| N21 | 0.312 ± 0.004 | 0.275 ± 0.002 | 0.87 ± 0.057 |
| N22 | 0.203 ± 0.002 | 0.201 ± 0.006 | 0.98 ± 0.0152 |
| N23 | 0.284 ± 0.004 | 0.271 ± 0.004 | 0.95 ± 0.00 |
| N24 | 0.344 ± 0.003 | 0.392 ± 0.0034 | 1.13 ± 0.0 |
| N25 | 0.295 ± 0.004 | 0.259 ± 0.003 | 0.87 ± 0.0 |
| N26 | 0.204 ± 0.003 | 0.203 ± 0.002 | 0.99 ± 0.0057 |
| N27 | 0.299 ± 0.045 | 0.250 ± 0.0031 | 0.84 ± 0.12 |
| N28 | 0.362 ± 0.06 | 0.274 ± 0.005 | 0.76 ± 0.115 |
| N29 | 0.278 ± 0.0036 | 0.274 ± 0.002 | 0.98 ± 0.0057 |
| N30 | 0.949 ± 0.0042 | 0.739 ± 0.004 | 0.77 ± 0.0 |
| N31 | 0.309 ± 0.002 | 0.308 ± 0.007 | 0.99 ± 0.015 |
| N32 | 0.211 ± 0.006 | 0.246 ± 0.003 | 1.16 ± 0.02 |
| N33 | 0.179 ± 0.003 | 0.181 ± 0.006 | 1.00 ± 0.015 |
| N34 | 0.172 ± 0.004 | 0.166 ± 0.003 | 0.96 ± 0.0057 |
| N35 | 0.274 ± 0.005 | 0.274 ± 0.005 | 1.00 ± 0.0 |
| N36 | 0.185 ± 0.0042 | 0.186 ± 0.004 | 1.00 ± 0.0 |
| N37 | 0.165 ± 0.008 | 0.168 ± 0.039 | 1.01± 0.185 |
| N38 | 0.152 ± 0.0067 | 0.140 ± 0.056 | 0.89 ± 0.315 |
| N39 | 0.138 ± 0.008 | 0.145 ± 0.003 | 1.05 ± 0.04 |
| N40 | 0.200 ± 0.0074 | 0.188 ± 0.0023 | 0.93 ± 0.025 |
| N41 | 0.254 ± 0.0045 | 0.251 ± 0.0045 | 0.98 ± 0.0 |
| N42 | 0.235 ± 0.0022 | 0.240 ± 0.023 | 1.01 ± 0.085 |
| N43 | 0.202 ± 0.0032 | 0.175 ± 0.04 | 0.85 ± 0.185 |
| N44 | 0.224 ± 0.0054 | 0.277 ± 0.023 | 1.23 ± 0.07 |
| N45 | 0.160 ± 0.0039 | 0.161 ± 0.0034 | 1.0 ± 0.0057 |
| N46 | 0.344 ± 0.0045 | 0.311 ± 0.0012 | 0.91 ± 0.025 |
| N47 | 0.168 ± 0.0023 | 0.150 ± 0.0041 | 0.89 ± 0.01 |
| N48 | 0.150 ± 0.0067 | 0.137 ± 0.030 | 0.90 ± 0.16 |
| N49 | 0.136 ± 0.0022 | 0.132 ± 0.0056 | 0.96 ± 0.025 |
| N50 | 0.120 ± 0.0023 | 0.106 ± 0.06 | 0.87 ± 0.48 |
TABLE 9: NORMAL SAMPLES AGAINST NORMOTENSIVE BIOSENSOR
| Sample no. | Before Hybridization | After Hybridization | Fluorescence enhancement |
| N1 | 0.300 ± 0.0034 | 0.369 ± 0.0023 | 1.22 ± 0.0057 |
| N2 | 0.212 ± 0.0074 | 0.222 ± 0.004 | 1.04 ± 0.0152 |
| N3 | 0.177 ± 0.0054 | 0.176 ± 0.0023 | 0.99 ± 0.02 |
| N4 | 0.167 ± 0.007 | 0.164 ± 0.004 | 0.98 ± 0.02 |
| N5 | 0.180 ± 0.008 | 0.183 ± 0.002 | 1.01 ± 0.035 |
| N6 | 0.216 ± 0.004 | 0.291 ± 0.005 | 1.34 ± 0.0 |
| N7 | 0.152 ± 0.006 | 0.162 ± 0.003 | 1.06 ± 0.02 |
| N8 | 0.161 ± 0.003 | 0.269 ± 0.001 | 1.66 ± 0.025 |
| N9 | 0.159 ± 0.007 | 0.145 ± 0.033 | 0.90 ± 0.170 |
| N10 | 0.198 ± 0.005 | 0.199 ± 0.067 | 0.99 ± 0.315 |
| N11 | 0.351 ± 0.034 | 0.439 ± 0.003 | 1.25 ± 0.115 |
| N12 | 0.242 ± 0.030 | 0.361 ± 0.00 2 | 1.5 ± 0.180 |
| N13 | 0.166 ± 0.004 | 0.231 ± 0.0045 | 1.38 ± 0.0057 |
| N14 | 0.163 ± 0.005 | 0.252 ± 0.0023 | 1.54 ± 0.035 |
| N15 | 0.213 ± 0.048 | 0.339 ± 0.0023 | 1.64 ± 0.372 |
| N16 | 0.170 ± 0.004 | 0.291 ± 0.002 | 1.71 ± 0.03 |
| N17 | 0.158 ± 0.00 3 | 0.299 ± 0.0023 | 1.89 ± 0.02 |
| N18 | 0.134 ± 0.002 | 0.262 ± 0.002 | 1.95 ± 0.01 |
| N19 | 0.160 ± 0.004 | 0.229 ± 0.004 | 1.57 ± 0.24 |
| N20 | 0.234 ± 0.002 | 0.351 ± 0.0012 | 1.49 ± 0.0057 |
| N21 | 0.246 ± 0.004 | 0.343 ± 0.012 | 1.39 ± 0.02 |
| N22 | 0.200 ± 0.002 | 0.301± 0.003 | 1.50 ± 0.0 |
| N23 | 0.310 ± 0.006 | 0.363 ± 0.004 | 1.17 ± 0.01 |
| N24 | 0.147 ± 0.003 | 0.145 ± 0.005 | 0.98 ± 0.0152 |
| N25 | 0.137 ± 0.005 | 0.261 ± 0.005 | 1.90 ± 0.03 |
| N26 | 0.121 ± 0.004 | 0.217 ± 0.003 | 1.79 ± 0.03 |
| N27 | 0.105 ± 0.005 | 0.242 ± 0.002 | 2.30 ± 0.095 |
| N28 | 0.719 ± 0.003 | 0.999 ± 0.003 | 1.38 ± 0.0057 |
| N29 | 0.226 ± 0.006 | 0.353 ± 0.005 | 1.56 ± 0.02 |
| N30 | 0.124 ± 0.006 | 0.231 ± 0.002 | 1.86 ± 0.075 |
| N31 | 0.114 ± 0.003 | 0.331 ± 0.0032 | 2.88 ± 0.028 |
| N32 | 0.114 ± 0.004 | 0.201 ± 0.004 | 1.76 ± 0.03 |
| N33 | 0.109 ± 0.002 | 0.217 ± 0.0052 | 1.98 ± 0.015 |
| N34 | 0.136 ± 0.007 | 0.257 ± 0.0083 | 1.88 ± 0.035 |
| N35 | 0.136 ± 0.004 | 0.239 ± 0.0067 | 1.75 ± 0.0 |
| N36 | 0.110 ± 0.005 | 0.207 ± 0.0045 | 1.87 ± 0.045 |
| N37 | 0.101 ± 0.003 | 0.187 ± 0.05 | 1.83 ± 0.44 |
| N38 | 0.108 ± 0.002 | 0.231 ± 0.00 2 | 2.13 ± 0.025 |
| N39 | 0.132 ± 0.008 | 0.239 ± 0.005 | 1.81 ± 0.07 |
| N40 | 0.129 ± 0.004 | 0.239 ± 0.003 | 1.84 ± 0.035 |
| N41 | 0.235 ± 0.007 | 0.305 ± 0.005 | 1.29 ± 0.015 |
| N42 | 0.127 ± 0.004 | 0.308 ± 0.004 | 2.42 ± 0.045 |
| N43 | 0.113 ± 0.007 | 0.183 ± 0.00 3 | 1.61 ± 0.07 |
| N44 | 0.126 ± 0.0044 | 0.198 ± 0.006 | 1.56 ± 0.0057 |
| N45 | 0.116 ± 0.040 | 0.208± 0.003 | 1.49 ± 0.68 |
| N46 | 0.143 ± 0.003 | 0.283 ± 0.005 | 1.97 ± 0.0057 |
| N47 | 0.118 ± 0.002 | 0.263 ± 0.004 | 2.22 ± 0.0057 |
| N48 | 0.098 ± 0.0032 | 0.214 ± 0.002 | 2.18 ± 0.05 |
| N49 | 0.113 ± 0.004 | 0.233 ± 0.0032 | 2.05 ± 0.045 |
| N50 | 0.140 ± 0.0023 | 0.262 ± 0.0045 | 1.87 ± 0.0 |
Applying Hardy - Weinberg’s Law: Hardy-Weinberg equation helps to calculate the genotype frequency from allele frequency in a population as given in Table 10 and Table 11 include derived allele frequencies where p is 0.68 for the C allele, and q is 0.32 for the T allele in hypertensive patients. In normotensive patients it is p is 0.78 for T allele and q is 0.22 for C allele. Hence, patients with CC genotype are associated with a higher risk of hypertension in Punjabi Population. Similar results were found in Northern Han Chinese population study where 4 polymorphisms of angiotensinogen gene, i.e., rs5050 (A-20C), rs5051 (A-6G), rs4762 (C3889T), and rs699 (C4072T) were genotyped. Here patients with CC genotypes, i.e. (C4072T or rs699) had a higher risk of hypertension 33.
TABLE 10: SAMPLE SIZE WITH HOMOZYGOUS rs699 MUTATION AND HETEROZYGOUS GENE
| Hypertensive Patients | Normotensive Patients | Total | |
| rs699+ (SNP, Homo ) | 30 | 8 | 38 |
| rs699- (Wild, Homo) | 12 | 36 | 48 |
| rs699+ / rs699- | 8 | 6 | 14 |
| Total | 50 | 50 | 100 |
TABLE 11: GENOTYPES AND ALLELE FREQUENCY IN AGT GENE M235T WHERE C ALLELE IS HYPERTENSIVE AND T ALLELE IS NORMOTENSIVE. C/C ARE HYPERTENSIVE HOMOZYGOTES, T/T ARE NORMOTENSIVE HOMOZYGOTES, AND C/T ARE HETEROZYGOTES
| Polymorphism | Type and number of patients | Allele frequency |
| AGT gene, C4072T mutation or rs699 | Hypertensive subjects
30 C/C 12 T/T 08 C/T |
0.68 C 0.32 T |
| Normotensive subjects
08 C/C 36 T/T 06 C/T |
0.22 C 0.78 T |
|
| Total samples (Hypertensive + Normotensive)
38 C/C 48 T/T 14 C/T |
0.45 C 0.55 T |
CONCLUSION: Verma et al., developed MB based biosensor against rs699 angiotensin SNP associated with Hypertension in certain populations. This biosensor detected ‘C’ allele in presynthesized target oligonucleotides at 35 °C with 5 min response time. For most of the molecular beacon assays on a solid surface, the specific/nonspecific signal ratios obtained are in the range of only 2 - 6 46 - 48. By comparison, our surface immobilized molecular beacons can distinguish a G/C mismatch of its 28th nucleotide position. Here 3 fold enhancement was observed 23.
This biosensor was successfully applied to 100 blood samples (50 hypertensive and 50 normotensives). Here hypertensive subjects tested positive against Hypertensive Biosensor were associated with essential hypertension. The p-value for hypertensive patients was 0.68 which was estimated by Hardy-Weinberg Law. This proved that rs699 SNP is associated with hypertension in Punjabi Population. However, certain samples that were clinically hypertensive but tested negative against hypertensive biosensor had hypertension because of some other gene mutation and interaction.
The application was cross-validated by applying hypertensive and normotensive samples to Normotensive Biosensor. Here normotensive samples fluoresced and hypertensive does not. But there were certain samples that were clinically naive but fluoresced. These can develop hypertension in the future due to hypertensive allele presence. Hence can help in the future pharmacogenetic based treatment of patients. Certain samples that fluoresced with both hypertensive and normotensive biosensor were heterozygous. Here presence or absence of hypertension depends upon gene interaction to environmental stimuli.
Significance: Although, evolution is a common occurrence in natural populations, allele frequencies remain unaltered unless any evolutionary mechanisms such as natural selection or mutation cause them to change. Before Hardy and Weinberg, the theory genophagy (gene eating) was thought to be correct which means that dominant alleles must, over time, inevitably swamp recessive alleles out of existence. In other words, dominant alleles always increase in frequency from generation to generation. Hardy and Weinberg demonstrated that dominant alleles could also decrease in frequency.
Here in our results, the frequency of a dominant wild T allele is 0.32 which is less than mutant C allele, i.e. 0.68 in a case of hypertensive subjects. Thus, there is no such deviation in results from Hardy-Weinberg’s Law.
ACKNOWLEDGEMENT: The authors are thankful to DBT - Punjabi University, Patiala Interdisciplinary Programme in Life Sciences for Advanced Research and Education for providing the partial financial assistance in carrying out the study (File No.: BT/PR4548/INF/22/146/2012).
CONFLICT OF INTEREST: Nil
REFERENCES:
- Tyagi S and Kramer FR: Molecular beacons: probes that fluoresce upon hybridization. Nature Biotechnology 1996; 14: 303-308.
- Tyagi S,Bratu DP and Kramer FR: Multicolor molecular beacons for allele discrimination. Nature Biotechnology 1998; 49-53.
- Tong W, Wang K and Drake T: Molecular beacons. Current Opinion in Chemical Biology 2004; 547-553.
- Drake TJ and Tan W: Molecular beacon DNA probes and their bioanalytical applications. Applied Spectroscopy 2004;58: 269A-280A.
- Kolpaschchikov DM: An elegant biosensor molecular beacon probe, challenges and recent solutions. Scientifica 2012.
- Marras SA, Tyagi S and Kramer FR: Real-time assays with molecular beacons and other fluorescent nucleic acid hybridization probes. Clinica Chimica Acta 2006; 363: 48-60.
- Kruglyak L: Prospects for whole-genome linkage disequilibrium mapping of common disease genes. Nature Genetics 1999; 22: 139-144.
- Ohnishi Y, Tanaka T, Ozaki K, Yamada R, Suzuki H and Nakamura Y: A high-throughput SNP typing system for genome-wide association studies. Journal of Human Genetics 2001; 46: 471-477.
- Collins FS, Patrinos A, Jordan E, Chakravati A, Gesteland R and Walters L: New goals for U.S. human genome project: 1998-2003.Science 1998; 282: 682-689.
- Cargill M, Altshuler D, Ireland J, Sklar P, Ardlie K, Patil N, Lane CR, Lim EP, Kalyanaraman N, Nemesh J, Ziaugra L, Friedland L, Rolfe A, Warrington J, Lipshutz R, Daley GQ and Lander ES: Characterization of single-nucleotide polymorphisms in coding regions of human genes. Nature Genetics 1999; 22: 231-238.
- Benetos A, Gautier S, Ricard S, Topouchian J, Asmar R, Poirier O, Larosa E, Guize L, Safar M, Soubrier F and Cambien F: Influence of angiotensin-converting enzyme and angiotensin II type 1 receptor gene polymorphisms on aortic stiffness in normotensive and hypertensive patients. Circulation 1996; 94: 698-703.
- Siffert W, Rosskopf D, Siffert G, Busch S, Moritz A, Erbel R, Sharma AM, Ritz E, Wichmann HE, Jakobs KH and Horsthemke B: Association of human G-protein B3 subunit variant with hypertension. Nature Genetics 1998; 18: 45-48.
- Glenn CL, Wang WY, Benjafield AV and Morris BJ: Linkage and association of tumor necrosis factor receptor 2 locus with hypertension, hypercholesterolemia and plasma shed receptor. Human Molecular Genetics 2000; 9: 1943-1949.
- Ji L, Na Z, Peng S, Ping W, Yue-Miao Z, Xing WH and Xu Jin: Association of angiotensinogen gene M235T and angiotensin-converting enzyme gene I/D polymorphisms with essential hypertension in Han Chinese population: a meta-analysis. Journal of Hypertension 2010; 28: 419-428.
- Jeunemaitre X, Soubrier F, Kotelevtsev YV, Lifton RP, Williams CS, Charru A, Hunt SC, Hopkins PN, Williams RR, Lalouel JM and Corvol P: Molecular basis of human hypertension: role of angiotensinogen. Cell 1992; 71: 169-180.
- Sato N, Katsuya T, Rakugi H, Takami S, Nakata Y, Miki T, Higaki J and Ogihara T: Association of variants in critical core promoter element of angiotensinogen gene with increased risk of essential hypertension in Japanese. Hypertension 1997; 30: 321-325.
- Staessen JA, Kuznetsova T, Wang JG, Emelianov D, Vlietinck R and Fagard R: M235T angiotensinogen gene polymorphism and cardiovascular-renal risk. Journal of Hypertension 1999; 17: 9-17.
- Bernstein KE, Giani JF, Shen XZ and Gonzalez-Villalobos RA: Renal angiotensin-converting enzyme and blood pressure control. Current Opinion in Nephrology and Hypertension 2014; 23: 106-112.
- Terry KW Ma,Kevin KH Kam, Bryan P Yan and Yat-Yin Lam: Renin–angiotensin–aldosterone system blockade for cardiovascular diseases: current status. British Journal of Pharmacology 2010; 160: 1273-1292.
- Lane DA and Lip GY: Ethnic differences in hypertension and blood pressure control in the UK. Quarterly Journal of Medicine2001; 94: 391-396.
- Zhou HH, Koshakj RP, Silberstein DJ, Wilkinson GR and Wood AJJ: Racial Differences in Drug Response. The New England Journal of Medicine 1989; 320: 565-570.
- Jones DW: Hypertension in East Asia. American Journal of Hypertension1995; 8: 111s-114s.
- Tsai CT, Hwang JJ, Lai LP, Wang YC, Lin JL and Chiang FT: Interaction of gender, hypertension, and the angiotensinogen gene haplotypes on the risk of coronary artery disease in a large angiographic cohort Atherosclerosis 2009; 203: 249-256.
- Wang QS, Li YG, Chen XD, Yu JF, Wang J, Sun J, Lu SB, Jin L and Wang XF: Angiotensinogen polymorphisms and acquired atrial fibrillation in Chinese. Journal ofElectrocardiology 2010; 43: 373-377.
- Jia EZ,Xu ZX, Guo CY, Li L, Gu Y, Zhu TB, Wang LS, Cao KJ, Ma WZ and Yang ZJ: Renin-angiotensin-aldosterone system gene polymorphisms and coronary artery disease: detection of gene-gene and gene-environment interactions. Cellular Physiology and Biochemistry 2012; 29: 443-452.
- Lemos RR, de Lima SG, da Cunha JE, Oliveira DF, de Souza MB, Ayres CF, Albuquerque MF and Oliveira JR: Revising the M235T polymorphism position for the AGT gene and reporting a modifying variant in the Brazilian population with potential cardiac and neural impact: The Journal ofMolecular Neuroscience 2012; 48: 253-256.
- Kolder IC, Michels M, Christiaans I, Ten Cate FJ, Majoor-Krakauer D, Danser AH, Lekanne Deprez RH, Tanck M, Wilde AA, Bezzina CR and Dooijes D: The role of renin-angiotensin-aldosterone system polymorphisms in phenotypic expression of MYBPC3-related hypertrophic cardiomyopathy. European Journal of Human Genetics 2012; 20: 1071-1077.
- Pemberton TJ, Mehta NU, Witonsky D, Di Rienzo A, Allayee H, Conti DV and Patel PI: Prevalence of common disease-associated variants in Asian Indians. BMC Genetics2008; 9-13.
- Conen D, Cheng S, Steiner LL, Buring JE, Ridker PM and Zee RY: Association of 77 polymorphisms in 52 candidate genes with blood pressure progression and incident hypertension: the Women's Genome Health Study. Journal of Hypertension2009; 27: 476-483.
- Gu D,Kelly TN, Hixson JE, Chen J, Liu D, Chen JC, Rao DC, Mu J, Ma J, Jaquish CE, Rice TK, Gu C, Hamm LL, Whelton PK and He J: Genetic variants in the renin-angiotensin-aldosterone system and salt sensitivity of blood pressure. Journal of Hypertension 2010; 28: 1210-1220.
- Yugar-Toledo JC, Martin JF, Krieger JE, Pereira AC, Demacq C, Coelho OR, Pimenta E, Calhoun DA and Júnior HM: Gene variation in resistant hypertension: multilocus analysis of the angiotensin 1-converting enzyme, angiotensinogen, and endothelial nitric oxide synthase genes. DNA and Cell Biology 2011; 30: 555-564.
- Pawlik M, Mostowska A, Lianeri M, Oko A and Jagodziński PP: Association of aldosterone synthase (CYP11B2) gene -344T/C polymorphism with the risk of primary chronic glomerulonephritis in the Polish population. Journal of theRenin-Angiotensin-Aldosterone System 2014; 15: 553-558.
- Li H, Du Z, Zhang L, Wu T, Deng Z, Li J, Cong M, Liu J and Qiu C: The relationship between angiotensinogen gene polymorphisms and essential hypertension in a Northern Han Chinese population. 2014; 65: 614-619.
- Assareh AA, Mather KA, Crawford JD, Wen W, Anstey KJ, Easteal S, Tan X, Mack HA, Kwok JB, Schofield PR and Sachdev PS: Renin-angiotensin system genetic polymorphisms and brain white matter lesions in older Australians. American Journal of Hypertension2014; 27: 1191-1198.
- Sasaki M, Yamada K, Namba H, Yoshinaga M, Du D and Uehara Y: Angiotensinogen gene polymorphisms and food-intake behavior in young, normal female subjects in Japan. Nutrition 2013; 29: 60-65.
- Rudkowska I, Dewailly E, Hegele RA, Boiteau V, Dubé-Linteau A, Abdous B, Giguere Y, Chateau-Degat ML and Vohl MC: Gene-diet interactions on plasma lipid levels in the Inuit population. British Journal of Nutrition2013; 109: 953-961.
- Park HK, Kim MC, Kim SM and Jo DJ: Assessment of two missense polymorphisms (rs4762 and rs699) of the angiotensinogen gene and stroke. Experimental and TherapeuticMedicine 2013; 5: 343-349.
- Singh DK, Jajodia A, Kaur H, Kukreti R and Karthikeyan M: Gender-specific association of RAS gene polymorphism with essential hypertension: a case-control study. BioMed Research International2014; 538053.
- Bhagi S, Srivastava S, Tomar A, Bala Singh S and Sarkar S: Positive Association of D Allele of ACE Gene With High Altitude Pulmonary Edema in Indian Population. Wildernessand Environmental Medicine 2015; 26: 124-132.
- Jia EZ, Chen ZH, An FH, Li LH, Li-Li, Guo CY, Gu Y, Liu Z, Li ZY, Zhu TB, Wang LS, Li CJ, Kong XQ, Ma WZ and Yang ZJ: Relationship of renin-angiotensin-aldosterone system polymorphisms and phenotypes to mortality in Chinese coronary atherosclerosis patients. Scientific Reports2014; 11: 4600.
- Imaizumi T, Ando M, Nakatochi M, Maruyama S, Yasuda Y, Honda H, Kuwatsuka Y, Kato S, Kondo T, Iwata M, Nakashima T, Yasui H, Takamatsu H, Okajima H, Yoshida Y and Matsuo S: Association of interactions between dietary salt consumption and hypertension-susceptibility genetic polymorphisms with blood pressure among Japanese male workers. Clinicaland Experimental Nephrology 2016; 21: 457-464.
- Verma N, Kaur N and Singh AK: Study of rs699 SNP of Hypertensive Patients with Gold Surface Immobilized Molecular Beacon Biosensor. International Journal of Recent Scientific Research 2016; 7: 10276-10281.
- Miller SA,Dykes DD and Polesky HF: A simple salting out procedure for extracting DNA from human nucleated cells. Nucleic Acids Research 1988; 16: 1215.
- Sambrook J, Fritsch EF and Maniatis T: Molecular Cloning: A Laboratory Manual. Cold Spring Harbor Laboratory Press, Nova York 1989.
- MerrilCR: Silver staining of proteins and DNA. Nature 1990; 343: 779-80.
- Li J, Tan W, Wang K, Xiao D, Yang X, He X and Tang Z: Ultrasensitive optical DNA biosensor based on surface immobilization of molecular beacon by a bridge structure. Analytical Sciences 2001; 10: 1149-1153.
- Frutos AG, Pal S, Quesada M and Lahiri J: Method for detection of single-base mismatches using bimolecular beacons. Journal of American Chemical Society 2002; 124: 2396-2397.
- Dodge A, Turcatti G, Lawrence I, Rooij NF and Verpoorte E: A Microfluidic Platform Using Molecular Beacon-Based Temperature Calibration for Thermal Dehybri-dization of Surface-Bound DNA. Analytical Chemistry 2004; 76: 1778-1787.
How to cite this article:
Verma N, Kaur N and Krishan P: Application of molecular beacon based biosensor against rs699 SNP in hypertensive and non- hypertensive Punjabi population. Int J Pharmacognosy 2018; 5(1): 37-50. doi link: http://dx.doi.org/10.13040/IJPSR.0975-8232.IJP. 5(1).37-50.
This Journal licensed under a Creative Commons Attribution-Non-commercial-Share Alike 3.0 Unported License.