


ANTIOXIDANT POTENTIAL OF FRACTIONS FROM THE STEM METHANOL EXTRACT OF UVARIA COMPEREI (ANNONACEAE)
HTML Full TextANTIOXIDANT POTENTIAL OF FRACTIONS FROM THE STEM METHANOL EXTRACT OF UVARIA COMPEREI (ANNONACEAE)
Marguerite Simo * 1, Maddalena Donati 2, Gaël Siwe 3, Stella Majoumouo 1, Zheng Chen 2, Rufin Toghueo 1, Rodrigue Keumoe 1, Pierre Jazet 4, Modeste Sameza 4 and Fabrice Fekam 1
Department of Biochemistry 1, Department of Animal Biology and Physiology Faculty of Science 3, University of Yaoundé I, Box 812, Yaoundé, Cameroon.
Department of Pharmacology and Anaesthesiology 2, University of Padova, Largo E. Meneghetti, 35131 Padova, Italy.
Laboratory of Biochemistry and Natural Substances 4, Faculty of Science, University of Douala, Box 24157, Douala, Cameroon.
ABSTRACT: Oxidative stress is incriminated in many human diseases such as cancer, diabetes, ischemia, rheumatoid arthritis, neurodegenerative diseases, etc. The extracts from plants could be used to discovering the new antioxidant product. In the aim to evaluate the antioxidant activity of fractions of Uvaria comperei stem extract, the fractions of the stem extract obtained by vacuum chromatography from Uvaria comperei were screened for their in vitro antioxidant properties. Total phenolic content, total flavonoid content, and phytochemical screening were also determined. The antioxidant activity was evaluated using DPPH and ORAC assays, whereas total phenolic and total flavonoid contents were determined using folin-ciocalteu method and aluminum chloride assay, respectively. The phytochemical constituents were assessed using standard methods. In the DPPH scavenging activity assay, the EC50 values of 6.03 µg/Ml to > 2000 µg/mL were obtained from the fractions. The fraction F16 showed the strongest scavenging activity with EC50 of 6.03 µg/mL near to the EC50 value of catechin (3.57 µg/mL). All the fractions presented the antioxidant activity with ORAC assay; however, the fraction F16 showed the greatest value of 6157 ± 316.4 µmoltrol/mL l. The results revealed that the total phenolic content (TPC) and total flavonoid content (TFC) varied among the different fractions obtained in various solvent systems. The fraction F16 had the highest quantity of phenolic compounds, whereas the less polar fractions possessed more flavonoids. The major groups of compounds identified using phytochemical screening were glycosides, alkaloids, and phenols. The results suggested that some fractions U. comperei could be used as natural antioxidants.
| Keywords: |
Fractions, antioxidant activity, Phenolic compounds, Phytochemical screening
INTRODUCTION: Oxidation is a basic part of aerobic life and our metabolism. During oxidation, many free radicals are produced and have an unpaired nascent electron.
Atoms of oxygen or nitrogen having a central unpaired electron are called reactive oxygen or nitrogen species 1, 2. These species, particularly the radical species, could cause peroxidation of membrane lipids, create oxidative damages on biological macromolecules, and enzyme 3, 4.
Reactive oxygen species have been implicated in over a hundred disease states, which range from arthritis and connective tissue disorders to carcinogenesis, aging, physical injury, infection, and cardiovascular malfunction 5.
Antioxidants play important roles to prevent fats and oils from becoming rancid and protect human body from the detrimental effects of free radicals. It can interfere with the oxidation process by reacting with free radicals, chelating catalytic metals, and also by acting as oxygen scavengers 3.
Crude extracts of fruits, herbs, vegetables, cereals, and other plant materials rich in phenolics are increasing of interest in the food industry because they retard oxidative degradation of lipids and thereby improve the quality and nutritional value of food. Current research is now directed towards finding naturally occurring antioxidants of plant origin. Antioxidants have been reported to prevent oxidative damage by free radical and reactive oxygen species; any of them may prevent the occurrence of disease, cancer, and aging. The medicinal properties of plants have been investi-gated in the recent scientific developments throughout the world, due to their potent antioxidant activities, without any side effects and economic viability 6, 7.
Phenolics compounds are very important plant constituents exhibiting antioxidant activity by inactivating lipid free radicals or by preventing the decomposition of hydroperoxides into free radicals 8. They are generally found in both edible and inedible plants. Polyphone compounds such as flavonoids and phenolic groups widely distributed in plants that have been reported to exert multiple biological effects, including antioxidant, free radical scavenging abilities, anti-inflammatory, antitumor 9, 10.
Annonaceae is one of the biggest families, which comprising about 130 genera; among them, plants Uvaria genus are used traditionally for the treatment of dysentery, wound, abdominal ache, and malaria 11. Plants extracts are sources of diverse secondary metabolites with many of them which display antioxidant and antimicrobial properties and, therefore, can protect the human body against both cellular oxidation reactions and pathogens 12, 13, 14.
The aim of this study was to evaluate the antioxidant activities, total phenolic, and flavonoid contents of fractions from the stem extract of Uvaria comperei (Annonaceae).
MATERIALS AND METHODS:
Plant Collection: The stem of Uvaria comperei, was harvested in February 2013 in Kalla Mount in Centre region of Cameroon and identified by the botanist Mr. Nana. Avoucher specimen of the plant (52882/HNC) has been deposited at the Cameroon National Herbarium in Yaoundé.
Extract Preparation: Freshly collected stem was chopped, dried, and ground into powder. A hundred grams (100 g) of powder was introduced in a conical flask and soaked for three days in 500 mL of methanol at room temperature. The resulting mixture was filtered through a filter paper and then roto-evaporated until complete alcohol evaporation was obtained.
Fractionation: The concentrated methanolic extract was fractionated by vacuum chromate-graphy by using silica-gel 40 (0.2-0.5 mm) and eluted with solvents (hexane, ethyl acetate, and methanol) of increasing polarity leading to several fractions. The elution was done successively with a gradient system of Hex-Hex / EtOAc-EtOAc-EtOAc / MeOH-MeOH (100% Hex-100% MeOH). Four hundred milliliter (400 mL) of each elution was evaporated to dryness under reduced pressure, and 202 fractions were obtained and mixed according to their thin layer chromatographic profile using merk silica gel 60 F254 to give 28 new fractions. UV light (ƛmax=254 nm, 366 nm) and 50% aqueous sulfuric acid concentrated were used to visualize TLC plates. From the previous results, 18 fractions that presented a good antifungal activity were assayed for their total phenolic content, total flavonoid content, and antioxidant activities.
Antioxidant Activity:
DPPH Radical Scavenging: Radical-scavenging activity, using 1, 1-diphenyl-2-picryl-hycrazyl was carried out as previously described by Brand-williams 15. Briefly, 40 µL of each fraction (dissolved in methanol or DMSO) was mixed with a DPPH solution (dissolved in methanol).
The mixture was agitated, incubated at room temperature for 1 h in the darkness, and the absorbance of samples was read at 517 nm. Catechin was used as a positive control. Radical scavenging capacity was expressed as percentage effect (E %) and calculated using the following equation:
Percentage effect E % = Abs control - Abs sample / Abs control × 100
EC50 values were calculated from the antiradical curve (percentage effect vs sample concentrations).
Oxygen Radical Antioxidant Capacity (ORAC): Oxygen radical antioxidant capacity was measured by the modified method described by Gillespie et al., 16 and Cao et al., 17. 2, 2’-Azobis (2-amidino-propane) dihydrochloride (AAPH), fluorescein, and 6-hydroxy-2, 5, 7, 8 - tetra-methylchroman - 2-carboxylic acid (Trolox) were prepared in phosphate buffer (pH 7.4) and fractions were diluted in methanol at 5 µg/mL.
Four concentrations of trolox were prepared in the phosphate buffer to give 6.25 µM, 12.5 µM, 25 µM and 50 µM working solutions. In 24 well plates, 1.5 mL of fluorescein was added, followed by 250 µL of trolox for the control, 250 µl of buffer for the blank and 250 µL of extract for evaluation. After 10 min of incubation at 37 °C AAPH (250 µL) was added. Catechin (1 µg/mL) was used as a positive control.
After 1 h reading, ORAC values were calculated based on the net area under the curve (AUC) obtained by subtracting the AUC of the blank from that of a sample and compared to trolox standards curve. The final values were expressed in TEAC (Trolox equivalent antioxidant capacity).
Total Phenolic Content (TPC) Assay: TPC of the fractions were measured using the Folin-Ciocalteu method as described by Ainsworth et al., 18 and Singleton et al., 19 stock solution of standard (Gallic acid) was prepared at 5 mg/mL in methanol.
The concentrations of working standard in double distilled water ranged from 0.5 µg/mL to 5 µg/mL. The fractions were prepared at a concentration of 500 µg/mL. Fifty microliters (50 µL) of a sample or standard solutions were transferred into a test’s tubes containing 4.2 mL of folin-ciocalteu reagent and mixed.
After 5 min at room temperature, 0.75 mL of sodium carbonate was added to the mixture and mixed gently. After incubation at room temperature for 120 min, the absorbance was read at 760 nm using the Perkin Elmer Lambda spectro-photometer. The standard calibration curve of gallic acid (0.00 to 0.005 mg/mL) was plotted. Results were expressed as milligrams of gallic acid equivalent per gram of dry weight.
Total Flavonoids Content (TFC) Assay: Total flavonoid content of fractions was determined using the aluminum chloride assay according to Fernandes et al., 20 an aliquot (0.2 mL) of the sample at 5 mg/mL were taken in different test tubes then 0.95 mL of distilled water was added followed by the addition of 0.1 mL of aluminum trichloride (2.5% AlCl3) and incubation for 15 min at room temperature.
After incubation, the absorbance was measured at 410 nm. The same procedure was repeated without the addition of AlCl3 for the preparation of the contrast solution.
A standard curve of known concentrations of quercetin standard solution, which were 0, 12.5, 25, 50, and 100 µg/mL was drawn. The results were expressed as milligrams of quercetin equivalents per gram of fractions.
Phytochemical Screening: Phytochemical analysis was performed using colorimetric method 21, 22, 23. Nine classes of secondary metabolites were screened: alkaloids, flavonoids, saponins, tannins, phenols, triterpenes, glucosides, anthocyanins, and anthraquinones.
Statistical Analysis: All data were presented as mean ± SEM with three replicates for each concentration of the prepared sample. Mean, SEM, and curves were obtained from Graph Pad Prism version 6.01.
RESULTS AND DISCUSSION: In order to facilitate the comprehension of the following results, all the fractions obtained in this study were codified as depicted in Table 1.
Phytochemical Screening Result: Phytochemical analysis Table 2 presents different groups of metabolites present infractions. The major group of compounds identified using phytochemical screening is glycosides, alkaloids, and phenols.
TABLE 1: CODIFICATION OF DIFFERENT FRACTIONS
| Fractions | Solvents | Codification |
| 1-6 | Hex/EtOAc | F1 |
| 7 | Hex/EtOAc | F2 |
| 8 | Hex/EtOAc | F3 |
| 9 | Hex/EtOAc | F4 |
| 10-11 | Hex/EtOAc | F5 |
| 12 | Hex/EtOAc | F6 |
| 13-14 | Hex/EtOAc | F7 |
| 15-18 | Hex/EtOAc | F8 |
| 19 | Hex/EtOAc | F9 |
| 20-24 | Hex/EtOAc | F10 |
| 25-34 | Hex/EtOAc | F11 |
| 35 | Hex/EtOAc | F12 |
| 36-39 | Hex/EtOAc | F13 |
| 40-49 | Hex/EtOAc | F14 |
| 50-55 | Hex/EtOAc | F15 |
| 56-62 | Hex/EtOAc | F16 |
| 63-74 | Hex/EtOAc | F17 |
| 75-85 | Hex/EtOAc | F18 |
| 86-94 | EtOAc | F19 |
| 95-99 | EtOAc | F20 |
| 100-109 | EtOAc | F21 |
| 110-116 | EtOAc/MeOH | F22 |
| 118-127 | EtOAc/MeOH | F23 |
| 128-136 | EtOAc/MeOH | F24 |
| 137-149 | EtOAc/MeOH | F25 |
| 155-163 | EtOAc/MeOH | F26 |
| 164-178 | EtOAc /MeOH | F27 |
| 191-202 | MeOH | F28 |
The elution was done successively with a gradient system (100% hex-100% MeOH). EtOAc (Ethyl acetate), hex (Hexane), MeOH (Methanol)
TABLE 2: PHYTOCHEMICAL SCREENING OF FRACTIONS
| F2 | F3 | F4 | F5 | F6 | F7 | F8 | F9 | F10 | F11 | F12 | F13 | F14 | F15 | F16 | F18 | F24 | F26 | |
| phenol | - | + | + | + | + | + | + | - | + | - | - | - | - | - | + | + | + | + |
| Tannin | - | - | + | - | + | - | - | - | - | - | - | - | - | - | + | + | + | + |
| Flavon | - | + | + | + | + | + | + | - | - | - | - | - | - | - | + | + | + | + |
| Saponin | + | - | - | + | - | - | - | + | - | - | - | - | - | - | - | - | - | - |
| Alkaloid | + | + | + | + | + | + | + | + | + | + | + | - | + | - | - | - | - | + |
| Anthra | - | - | - | - | - | - | - | - | - | - | - | - | - | + | + | + | + | + |
| Glyco | + | + | + | + | + | + | + | + | + | + | + | + | - | - | - | + | + | + |
| Anthro | - | - | - | - | - | - | - | - | - | - | - | - | - | - | - | - | - | |
| Triterp | - | - | - | - | - | - | - | - | + | + | - | - | - | - | + | + | + | + |
Phytochemical analysis was performed using a colorimetric assay to detect the presence of alkaloids, flavonoids (Flavon), saponins, tannins, phenols, triterpenes (Triterp), glycosides (Glyco), anthocyanins (Anthro) and anthraquinones (anthra) in different fractions (+) = Presence; (-) = Absence
Antioxidant Results:
DPPH Results: Fig. 1 shows that among all tested fractions, fraction F16 showed considerably high free radical scavenging activity with an EC50 = 6.03 µg/mL close to positive control (catechin) value (EC50 = 3.57 µg/mL), followed by fraction F15 with EC50 = 13.55 µg/mL and fraction F24 with EC50 = 13.64 µg/mL. As for the EC50, the lowest concentration was shown by fraction F4 followed by fraction F10; however, the fractions F2 and F3 presented the EC50> 2000µg/mL and fraction F5, EC50> 1000µg/mL. The first few fractions which were apolar showed weak antiradical activity than polar fractions, which had a high quantity of phenolic compounds. The fractions showed a concentration-dependent scavenging activity.
ORAC Results: Table 3 shows the ORAC results of fractions. Oxygen radical antioxidant Capacity was exhibited by all fractions however fraction F16 had high activity with 6157 ± 316.4 µmoltrol/mL followed by fraction F7 (4652 ± 382.1 µmoltrol/mL), fraction F14 (4572 ± 221.1 µmoltrol/ml) and fraction F15 (4114 ± 158.1 µmoltrol/mL). Catechin had the highest activity with 144095 ± 7434 µmoltrol/mL. All the fractions showed moderate antioxidant capacity compared to catechin. The highest antioxidant capacity was observed with fractions F16. Phenolic constituents found in our plant extracts have been shown to neutralize free radicals in various testing systems and was assessed to establish a correlation between antioxidant activity and total phenolic content.
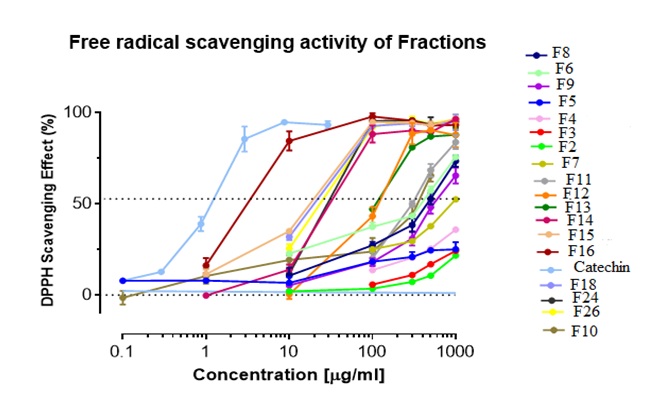
FIG. 1: VARIATION OF SCAVENGING PERCENTAGE WITH FRACTIONS CONCENTRATIONS. The percentage of scavenging of DPPH radical (%) for each fraction at different concentrations was given by each curve. Catechin was used as a standard. Each point represents mean ± SEM
TABLE 3: ORAC ACTIVITY OF FRACTIONS
| Fractions | Orac |
| µmoltrol/ml | |
| F2 | 2098 ± 315.7 |
| F3 | 1966 ± 190.2 |
| F4 | 2773 ± 212.6 |
| F5 | 191 ± 384.2 |
| F6 | 3479 ± 408.2 |
| F7 | 4652 ± 382.1 |
| F8 | 5759 ± 548.0 |
| F9 | 1414 ± 265.7 |
| F10 | 3510 ± 221.1 |
| F11 | 2306 ± 234.1 |
| F12 | 2206 ± 191.6 |
| F13 | 3193 ± 313.2 |
| F14 | 4572 ± 221.1 |
| F15 | 4114 ± 158.1 |
| F16 | 6157 ± 316.4 |
| F18 | 3650 ± 204.8 |
| F24 | 3553 ± 391.8 |
| F26 | 2915 ± 187.5 |
| catechin | 144095 ± 7434 |
Radical scavenging capacity was expressed as EC50. EC50 values were calculated from antiradical curve (percentage effect vs sample concentrations).The ORAC results values were expressed in TEAC (Trolox equivalent antioxidant capacity). Catechin was used as a psitive antioxidant control. Values are expressed as mean ± SEM
Total Phenolic and Flavonoid Content Results: The total phenolic content values Table 4 was quantified based on the linear equation obtained from the gallic acid standard calibration curve. Thus, TPC values were expressed as gallic acid equivalent (mg GAE/ g samples).
The quantitative analysis of TPC of different fractions revealed that the fraction F16 contained the highest amount of TPC (80.087 ± 1.127 mgGAE/g), followed by fraction F15 (70,741 ± 2,180 mgGAE/g) and fraction F7 (61,397 ± 4,842 mgGAE/g). The fraction F16, which showed the high antioxidant activity contents had a high quantity of phenolic compounds. The polar fractions contained a higher phenolic compound than less polar or less polar fractions. Table 4 also presents the TFC results of fractions. TFC values were quantified based on the linear equation obtained from the quercetin standard calibration curve. The amount of total flavonoid ranged from 0 to 62.741 ± 5.180 mg QE/g of material. The highest total flavonoid level was detected in fraction F7 (62.741 ± 5.180 mg QE/g) followed by fraction F6 (54.23 ± 3.235 mg QE/g) and fraction F8 (50.977 ± 2.39 1 mg QE/g).
TABLE 4: TOTAL PHENOLIC AND FLAVONOID CONTENT OF FRACTIONS
| Fractions | TPC | TFC |
| GAE mg/g | QE mg/g | |
| F2 | // | 10.116 ± 1.195 |
| F3 | 0.9713 ± 1.331 | 17.947 ± 1.523 |
| F4 | 7.419 ± 2.206 | 46.585 ± 2.328 |
| F5 | // | 28.192 ± 1.696 |
| F6 | 16.14 ± 1.839 | 64.23 ± 3.235 |
| F7 | 38.56 ± 1.893 | 75.741 ± 5.180 |
| F8 | 13.86 ± 2.543 | 58.977± 2.391 |
| F9 | 6.318 ± 1.093 | 15.427± 1.586 |
| F10 | 3.032 ± 0.985 | 15.354 ± 1.442 |
| F11 | 3.830 ± 0.522 | 19.753 ± 0.6045 |
| F12 | // | // |
| F13 | 6.173 ± 0.8063 | 4.961 ± 1.304 |
| F14 | 20.451 ± 1.310 | 14.657 ± 1.825 |
| F15 | 61.397 ± 6.842 | 3.288 ± 0.6370 |
| F16 | 80.087 ± 1.127 | // |
| F18 | 30.698 ± 2.185 | 4.592 ± 1.035 |
| F24 | 16.856 ± 2.544 | 10.352 ± 2.320 |
| F26 | 22,577 ± 1.326 | 5.628 ± 0.7926 |
The TPC results were expressed as milligrams of gallic acid equivalent per gram of dry weight (GAEmg/g). Gallic acid was used as a standard. The TFC results were expressed as milligrams of quercetin equivalents per gram of fractions (QEmg/g). Quercetin was used as a standard. Values are expressed as mean ± SEM. //= Negative values were obtained
The observation of antioxidant activity in this study may be linked to the presence of the identified phytochemicals such as flavonoids, tannins, phenolic compounds, and plant phenolics, which are a major group of compounds that act as primary antioxidants or free radical scavengers 24. Antioxidants prevent oxidative stress caused by free radicals, which damage cells and vital biomolecules. They end chain reactions triggered by free radicals by removing free radical intermediates and inhibit other oxidation reactions. Antioxidant systems minimize or prevent deleterious effects of the reactive oxygen species. The antioxidant property of extracts may strongly contribute to the management and treatment of various diseases and conditions such as cancer, cardiovascular, inflammatory, and neurodegenerative pathologies 25, 26.
The medicinal values of plants lie in their phytochemical components such as alkaloids, tannins, flavonoids, and other phenolic compounds, which produce a definite physiological action on the human body 27. In addition, many studies have demonstrated the antioxidant properties of polyphenolic compounds 10, tannins, flavonoids, phenolic acids, and phenolic diterpenes 27. Moreover, epidemiological studies have also shown that consumption of food and beverages with ample phenolic compounds can minimize the risk of heart disease. These compounds diminish the development of atherosclerosis through acting as antioxidants towards low-density lipoprotein 28.
The medicinal values of the plant could be related to their phytochemical components. According to Varadarajan et al., 29, the secondary metabolites and other chemical constituents of medicinal plants account for their medicinal value; for example, anthraquinones possess anti-inflammatory, astringent, moderate antitumor, purgative and antimicrobial effects. Polyphenolic compounds are also believed to have chemopreventive and suppressive activities against cancer cells by inhibition of metabolic enzymes involved in the activation of potential carcinogens or arresting the cell cycle 30.
CONCLUSION: The results obtained in this study suggest that the fractions have good antioxidant properties with glycosides, alkaloids, phenols, and flavonoids being are the most prominent phytoconstituents. However, the fraction F16 containing a high level of total phenolic compounds inhibited DPPH free radicals with a capacity nearly equal to catechin. The observed activity might be related to its content in phenolic compounds, as previously demonstrated. It is important to say that the fraction F16 contained a high level of total phenolic compounds and demonstrated high antioxidant activities. Meanwhile, further, investigations are required to identify the active principles responsible for these activities.
ACKNOWLEDGEMENT: The authors would like to acknowledge the support from the Department of Pharmaceutical and Pharmacological Sciences, University of Padua, Italy.
CONFLICTS OF INTEREST: The authors declare that they have no competing interests.
Financial Support: The authors would like to acknowledge the financial support from the Coimbra group program.
REFERENCES:
- Finkel T and Holbrook N: Oxidants, oxidative stress and the biology of ageing. Nature 2000; 408: 239-47.
- Halliwell B: The antioxidant paradox. The Lancet 2000; 355: 1179-80.
- Rackova L, Oblozinsky M, Kostalova D, Kettmann V and Bezakova L: Free radical scavenging activity and lipoxygenase inhibition of Mahonia aquifolium extract and isoquinoline alkaloids. J of Inflammation 2007; 4(15): 1-7.
- Wang X, Wang W, Li L, Perry G, Lee H and Zhu X: Oxidative stress and mitochondrial dysfunction in Alzheimer’s disease. Biochimica ET Biophysica Acta- Molecular Basis of Disease 2014; 1842(8): 1240-47.
- Losada-Barreiro S and Bravo-Díaz C: Free radicals and polyphenols: the redox chemistry of neurodegenerative diseases. European J of Medicinal Chemistry 2017; 133: 379-02.
- Agarwal A and Prabakaran S: Mechanism, measurement and prevention of oxidative stress in male reproductive physiology. Indian Journal of Experimental Biology 2005; 43: 963‐74.
- Sarr S, Fall A, Gueye R, Diop A, Sene B, Diatta K, Ndiaye B and Diop Y: Evaluation de l’activité antioxydante des extraits des feuilles de Aphaniasenegalensis (Sapindaceae) et de Saba senegalensis (Apocynaceae). International J of Biological and Chemical Sciences 2015; 9(6): 2676-84.
- Maisuthisakul P, Suttajit M and Pongsawatmanit R: Assessment of phenolic content and radical scavenging capacity of some Thai indigenous plants. Food Chemistry 2007; 100: 1409-18.
- Huang D, Ou B and Prior R: The chemistry behind antioxidant capacity assays. J of Agricultural and Food Chemistry 2005; 53: 1841‐56.
- Çekiç S, Cetinkaya A, Avan A and Apak R: Correlation of total antioxidant capacity with reactive oxygen species (ROS) consumption measured by oxidative conversion. J of Agricultural and Food Chemistry 2013; 61: 5260-70.
- Gina F, Renata B, Souza L, de-Freitas AH, Maas P and Pohlit A: Plants of the annonaceae traditionally used as antimalarials. A review edição especial 2014; 36: 315-36.
- Simo K, Sameza M, Jazet D, Fekam B, Bakargna-Via I, Hzounda F, Kenfack T, Zeuko’o M, AmvamZollo P and Menut C: Antiradical, anti-inflammatory and antifungal activities of essential oils of two aromatic plants: Apium graveolens (Apiaceae) and thymus vulgaris (Lamiaceae). Life Science Journal 2015; 9: 51-64.
- Taffou, Hzounda J, Zeuko’o E, Tchokouaha L, Ngoutane A, Simo M, Ngouana V, KenfackI and Fekam B: Anti-yeast potential of some annonaceae species from cameroonian biodiversity. International Journal of Biological and Chemical Sciences 2017; 11(1): 15-31.
- Tatsimo S, Tamokou J, Tsague V, Lamshoft M, Sarkar P, Bag P and Spiteller M: Antibacterial-guided isolation of constituents from senna alata leaves with a particular reference against multi-drug-resistant vibrio cholerae and shigellaflexneri. International Journal of Biological and Chemical Sciences 2017; 11(1): 46-53.
- Brand-Williams W, Cuvelier M and Berset C: Use of free radical method to evaluate antioxydant activity. LWT-Food Science and Technology1995; 28: 25-30.
- Gillespie K, Chae J and Ainsworth E: Rapid measurement of total antioxidant capacity in plants. Nature Protocols 2007; 2(4): 867-70.
- Cao G, Alessio H, Cutler R: Oxygen-radical absorbance capacity assay for antioxidants. Journal of Free Radicals in Biology and Medicine 1993; 14(3): 303-11.
- Ainsworth E and Gillespie K: Estimation of total phenolic content and other oxidation substrates in plant tissues using Folin-Ciocalteu reagent. Nature Protocols 2007; 2: 875-77.
- Singleton V and Rossi J: Colometry of total phenolics with phosphomolybdic phosphotungstic acid reagents. American Journal of Enology and Viticulture 1965; 16: 144-58.
- Fernandes A, Ferreira M, Randau K, De Souza T and Soares L: Total flavonoids content in the raw material and aqueous extractives from Bauhinia monandra Kurz (Caesalpiniaceae). Scientific World J 2012; 2012: 1-7.
- Sofowara A: Medicinal plants and traditional medicine in Africa. Ed 2nd Spectrum Books Limited Ibadan 1993; 97-145.
- Odebeyi O and Sofowara E: Phytochemical screening: Nigeria medical plants. Lloydia 1978; 41(31): 234-46.
- Harborne J: Phytochemical methods. a guide of modern techniques of plants analysis. Chapman and Hall London Ed 2nd 1976; 150.
- Kulawik P, Özogul F, Glew R and Özogul Y: Significance of antioxidants for seafood safety and human health. Journal of Agricultural and Food Chemistry 2013; 61(3): 475-91.
- Almeida B, de-Sousa M, Arriage C, do-Prado M, Magalhaes C, Maia A and Lemos A: Bioactive compounds and antioxidant activity of fresh exotic fruits from north-eastern Brazil. Food Research International 2011; 44: 2155-59.
- Dembitsky M, Poovarodom S, Leontowicz H, Leontowicz M, Vearasilp S, Trakhtenberg S and Gorinstein S: The multiple nutrition of some exotic fruits: biological activity and active metabolites. Food Research International 2011; 44: 1671-701.
- Gulçin I, Zubeyr H, Mahfuz E, Hassan Y and Aboul-Enein: Radical scavenging and antioxidant activity of tannic acid. Arabian Journal of Chemistry 2010; 3: 43-53.
- Kaur C and Kapoor H: Antioxidant activity and total phenolic content of some Asian vegetables. Internatonal Journal of Food Science and Technology 2002; 37: 153-61.
- Varadarajan P, Rathinaswamy G and Asirvatahm D: Antimicrobial properties and phytochemical constituents of rheo discolor. Ethnobotanical Leaflets 2008; 12: 841-45.
- Newman D, Gragg G and Holbeck S: Natural products as leads to cell cycle pathway targets in cancer chemo-therapy. Current Cancer Drug Targets 2002; 2(4): 279-08.
How to cite this article:
Simo M, Donati M, Siwe G, Majoumouo S, Chen Z, Toghueo R, Keumoe R, Jazet P, Sameza M and Fekam F: Antioxidant potential of fractions from the stem methanol extract of Uvaria comperei (Annonaceae). Int J Pharmacognosy 2019; 7(3): 76-82. doi link: http://dx. doi.org/10.13040/IJPSR.0975-8232.IJP.7(3).76-82.
This Journal licensed under a Creative Commons Attribution-Non-commercial-Share Alike 3.0 Unported License.
Article Information
4
76-82
527
1334
English
IJP
M. Simo *, M. Donati, G. Siwe, S. Majoumouo, Z. Chen, R. Toghueo, R. Keumoe, P. Jazet, M. Sameza and F. Fekam
Department of Biochemistry, Faculty of Science, University of Yaoundé I, Yaoundé, Cameroon.
simomagui@yahoo.fr
10 February 2020
24 March 2020
26 March 2020
10.13040/IJPSR.0975-8232.IJP.7(3).76-82
31 March 2020