FORMULATION AND EVALUATION OF TRANSDERMAL PATCHES OF KETOPROFIN BY USING DIFFERENT POLYMERS
HTML Full TextFORMULATION AND EVALUATION OF TRANSDERMAL PATCHES OF KETOPROFEN BY USING DIFFERENT POLYMERS
Shuwana Zakir *, Syeda Kahkasha Banu, Syeda Nuzhath Fatima, Tabassum Jahan, Wajida Firdous, P. Sireesha, S. Roshan and N. L. Mohammed
Azad College of Pharmacy, Moinabad, R.R. District, Hyderabad - 501504, Telangana, India.
ABSTRACT: The purpose of this research work was to develop and evaluate matrix-type transdermal patches of Ketoprofen. Employing different ratios of hydrophilic and hydrophobic polymers by a solvent evaporation technique. The physicochemical compatibility of the drug and the polymers was studied by Infrared Spectroscopy. The results suggested no physicochemical incompatibility between the drug and the polymers. Seven formulations (Consisting of hydroxypropyl methylcellulose E5 and ethylcellulose in the ratios of10:0, 0:10, 1:9, 2:8, 3:7, 4:6, 5:5 (F1, F2, F3, F4, F5, F6, F7) were prepared. All formulations carried dimethyl sulfoxide as a penetration enhancer and dibutyl phthalate as a plasticizer in chloroform and methanol (1:1) as the solvent system. The prepared TDDS were evaluated for in-vitro release, moisture absorption, moisture loss, and mechanical properties. The diffusion studies were performed by using modified Franz diffusion cells. Patch coded as F1 (HPMC alone) showed maximum release of 95.526 ± 0.982% in 8 h, whereas F2 (EC alone) showed maximum release of 67.078 ± 1.875% in 24 h and combination of polymers F7 (5:5) showed maximum release of 86.812 ± 0.262% in 24 h, emerging to be ideal formulation for Fenoprofen. The results followed Higuchi kinetics (r2), and the mechanism of release was diffusion mediated.
| Keywords: |
Ketoprofen, Solvent evaporation technique, Transdermal patch, Drug release, Skin permeation
INTRODUCTION: Transdermal drug delivery systems (TDDS) which can deliver medicines via the skin portal to systemic circulation at a predetermined rate and maintain clinically effective concentrations over a prolonged period. Optimization of drug delivery through human skin is important in modern therapy. With the limitations of oral drug delivery and the pain and needle phobias associated with traditional injections, drug delivery research has focused on the transdermal delivery route.
Delivery of drugs into systemic circulation via skin has generated a lot of interest during the last decade as TDDS offer many advantages over the conventional dosage forms and oral controlled release delivery systems notably avoidance of hepatic first-pass metabolism, decrease in frequency of administration, reduction in gastrointestinal side effects and improves patient compliance.
Ketoprofen, (RS) 2- (3-benzoylphenyl) - propionic acid (Chemical formula C16H14O3) is one of the propionic acid class of nonsteroidal anti-inflammatory drugs (NSAID) with analgesic and antipyretic effects. It acts by inhibiting the body's production of prostaglandin. Ketoprofen's exact mode of action is unknown, but it is thought that prostaglandin synthetase inhibition is involved. Ketoprofen has been shown to inhibit prostaglandin synthetase isolated from bovine seminal vesicles. The purpose of this research work was to develop and evaluate matrix-type transdermal patches of Ketoprofen. They are employing different ratios of hydrophilic and hydrophobic polymers by a solvent evaporation technique.
MATERIALS AND METHODS:
Materials: Ketoprofen, hydroxypropyl methyl- cellulose E 5, ethylcellulose, octanol, chloroform, methanol dimethyl sulphoxide, dibutyl phthalate, sodium hydroxide pellets, potassium dihydrogen orthophosphate, potassium chloride, fused calcium chloride, aluminium foils, etc.
Methods: Before going to formulation develop-ment, we did analytical method development of ketoprofen then we went to preformulation study. We did preformulation study including determination of pH, determination of melting point, determination of solubility, determination of partition coefficient, determination of drug-excipient compatibility by FTIR. After the formulation study, we went to the preparation of transdermal patches.
Preparation of Transdermal Patches: In the present study, drug loaded matrix type transdermal films of Ketoprofen were prepared by a solvent evaporation method. A mold of 5 cm length and 5cm width with a total area of 25 cm2 was fabricated and used. The bottom of the mold was wrapped with aluminium foil, 300 mg of the polymer(s) was accurately weighed and dissolved in 5 ml of chloroform: methanol (1:1) and kept aside to form a clear solution. Dibutyl phthalate was used as plasticizer and dimethyl sulfoxide was used as permeation enhancer as shown in table 5.3 and mixed thoroughly. 30 mg of KF was dissolved in the above solution and mixed for 10 min.
The resulted uniform solution was cast on the aluminium foil and dried at 40 °C in the hot air oven for 24 h. An inverted funnel was placed over the mold to prevent fast evaporation of the solvent. After 24 h the dried films were taken out and stored in a desiccator for further studies.
Evaluation: After preparation of transdermal patches, we evaluated transdermal patches including physical appearance, thickness uniformity, weight uniformity, folding endurance, percentage moisture absorption, percentage moisture loss, water vapor transmission rate, tensile strength, drug content uniformity of films, in-vitro drug release studies.
RESULTS:
Analytical Methods:
Determination of Max of Ketoprofen in pH 7.4 Phosphate Buffer Solution:
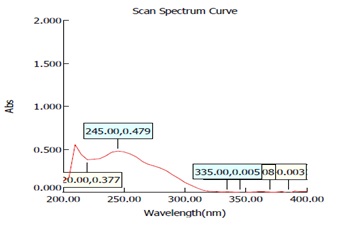
FIG. 1: UV SPECTRUM OF KETOPROFEN IN 245nm
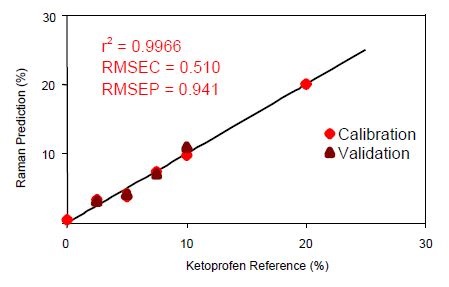
FIG. 2: CALIBRATION CURVE OF KETOPROFEN IN pH 7.4 BUFFER
TABLE 1: DATA FOR CALIBRATION CURVE OF KETOPROFEN IN pH 7.4 BUFFER SOLUTION
| S.
no. |
Concentration
µg/ ml |
Absorbance at 245 nm Mean ± D* |
| 1 | 0 | 0.000 ± 0.000 |
| 2 | 2.0 | 0.072 ± 0.008 |
| 3 | 4.0 | 0.138 ± 0.007 |
| 4 | 6.0 | 0.196 ± 0.012 |
| 5 | 8.0 | 0.261 ± 0.008 |
| 6 | 10.0 | 0.324 ± 0.008 |
| 7 | 12.0 | 0.399 ± 0.004 |
| 8 | 14.0 | 0.456 ± 0.011 |
| 9 | 16.0 | 0.519 ± 0.006 |
| 10 | 18.0 | 0.571 ± 0.004 |
| 11 | 20.0 | 0.640 ± 0.006 |
* Each value was an average of three determinations.
Preformulation Studies:
Physicochemical Properties of Ketoprofen:
TABLE 2: DATA OF VARIOUS PREFORMULATION
| S. no. | Drug | pH | Melting point | Solubility |
| 1 | Ketoprofen | 7.4 | 168–171 °C | 8.11e-02 g/l |
Drug-Excipients Compatibility Studies:
FT-IR Spectrum and Values:
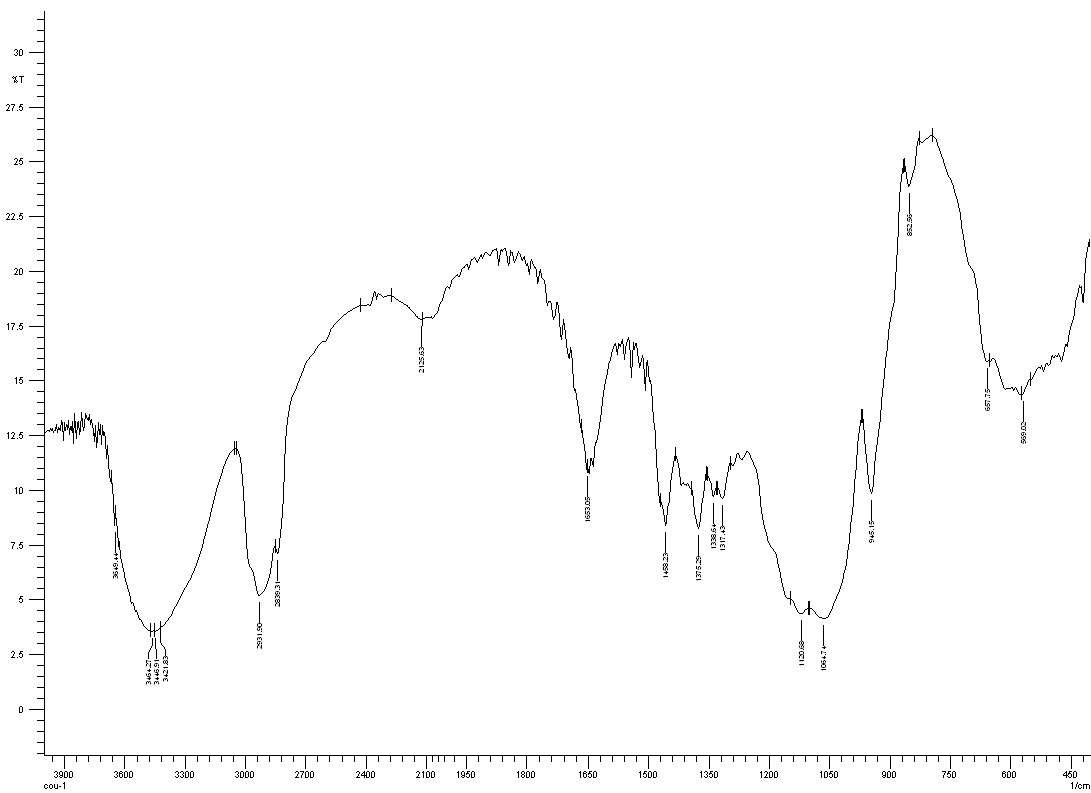
FIG. 3: IR SPECTRUM OF PURE KETOPROFEN
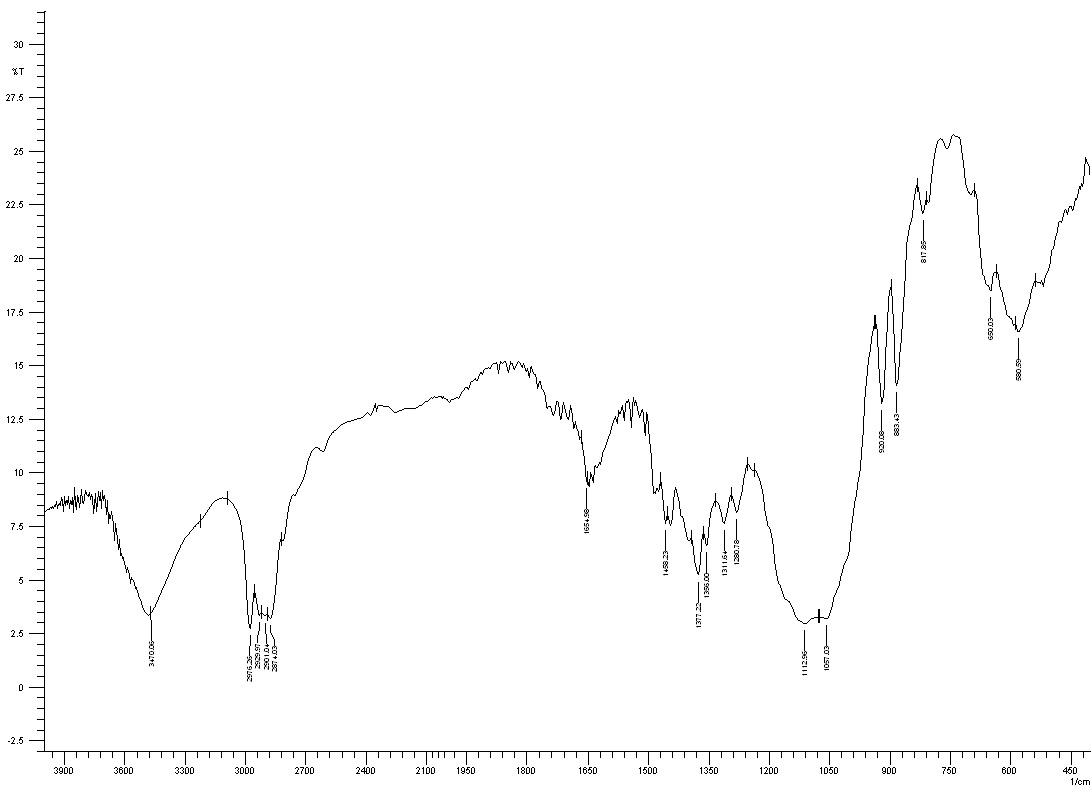
FIG. 4: IR SPECTRUM OF DRUG + EXCIPIENTS
TABLE 3: FT-IR SPECTRUM VALUES
| S. no. | IR spectrum | Groups | Peak (cm-1) | Stretching / Deformation |
| 1 | Ketoprofen | N- tertiary | 1552 | Stretching |
| CH2 | 1562 | Stretching | ||
| CH3 | 1242 | Stretching | ||
| C=O | 1524 | Stretching | ||
| C=C | 1345 | Stretching | ||
| C-N | 1265 | Stretching | ||
| C-S | 698 | Stretching | ||
| 2 | HPMC E5 | O-H | 3463 | Stretching |
| C-O-C | 1064 | Stretching | ||
| 3 | EC | CH2 | 2976 | Stretching |
| CH3 | 2873 | Stretching | ||
| C-O-C | 1056 | Stretching |
Formulation of Transdermal Patches:
TABLE 4: COMPOSITION OF DIFFERENT FORMULATIONS CONTAINING KETOPROFEN
| Formulations | F1 | F2 | F3 | F4 | F5 | F6 | F7 |
| Ketoprofen, mg | 200 | 200 | 200 | 200 | 200 | 200 | 200 |
| HPMC E (5cps), mg | 300 | * | 30 | 60 | 90 | 120 | 150 |
| Ethylcellulose, mg | * | 300 | 270 | 240 | 210 | 180 | 150 |
| Dibutyl phthalate (2 drop), ml | 0.12 | 0.12 | 0.12 | 0.12 | 0.12 | 0.12 | 0.12 |
| DMSO, ml | 0.06 | 0.06 | 0.06 | 0.06 | 0.06 | 0.06 | 0.06 |
| Chloroform: Methanol (1:1), ml | 5 | 5 | 5 | 5 | 5 | 5 | 5 |
* No ingredients was used; HPMC = Hydroxypropyl methylcellulose; DMSO = Dimethyl sulfoxide.
Evaluation of Transdermal Patches:
Thickness Uniformity:
TABLE 5: THICKNESS UNIFORMITY OF F1 TO F7 PATCHES FORMULATIONS
| S. no. |
Formulation
code |
Average thickness (mm) | |||
| Trial 1 | Trial 2 | Trial 3 | Average | ||
| 1 | F1 | 0.17 | 0.19 | 0.19 | 0.18 |
| 2 | F2 | 0.19 | 0.28 | 0.36 | 0.27 |
| 3 | F3 | 0.38 | 0.45 | 0.53 | 0.45 |
| 4 | F4 | 0.14 | 0.14 | 0.17 | 0.15 |
| 5 | F5 | 0.27 | 0.29 | 0.30 | 0.28 |
| 6 | F6 | 0.38 | 0.38 | 0.39 | 0.38 |
| 7 | F7 | 0.17 | 0.18 | 0.20 | 0.19 |
Weight Uniformity:
TABLE 6: WEIGHT UNIFORMITY OF F1 TO F7 PATCH FORMULATIONS
| S. no. |
Formulation
code |
Average thickness (mm) | |||
| Trial 1 | Trial 2 | Trial 3 | Average | ||
| 1 | F1 | 0.40 | 0.43 | 0.42 | 0.416 |
| 2 | F2 | 0.38 | 0.36 | 0.36 | 0.366 |
| 3 | F3 | 0.40 | 0.38 | 0.37 | 0.383 |
| 4 | F4 | 0.41 | 0.39 | 0.38 | 0.393 |
| 5 | F5 | 0.35 | 0.41 | 0.38 | 0.380 |
| 6 | F6 | 0.38 | 0.34 | 0.36 | 0.360 |
| 7 | F7 | 0.43 | 0.40 | 0.41 | 0.413 |
*Standard deviation, n = 3
Folding Endurance:
TABLE 7: FOLDING ENDURANCE OF F1 TO F7 PATCH FORMULATIONS
| S. no. |
Formulation
code |
Average thickness (mm) | |||
| Trial 1 | Trial 2 | Trial 3 | Average | ||
| 1 | F1 | 300 | 300 | 300 | 300.0 |
| 2 | F2 | 300 | 300 | 300 | 200.0 |
| 3 | F3 | 300 | 300 | 300 | 250.0 |
| 4 | F4 | 270 | 270 | 270 | 260.0 |
| 5 | F5 | 189 | 185 | 180 | 283.0 |
| 6 | F6 | 205 | 205 | 210 | 270.0 |
| 7 | F7 | 169 | 184 | 200 | 284.0 |
*Standard deviation, n = 3
Percentage Moisture Absorption:
TABLE 8: DATA OF PERCENTAGE MOISTURE ABSORPTION
| S. no. |
Formulation
code |
Average thickness (mm) | |||
| Trial 1 | Trial 2 | Trial 3 | Average | ||
| 1 | F1 | 4.651 | 6.97 | 9.3 | 6.973 |
| 2 | F2 | 0 | 2.63 | 2.63 | 1.753 |
| 3 | F3 | 0 | 2.94 | 2.94 | 1.960 |
| 4 | F4 | 2.70 | 2.70 | 5.50 | 3.630 |
| 5 | F5 | 2.43 | 2.43 | 4.87 | 3.243 |
| 6 | F6 | 2.70 | 5.40 | 5.40 | 4.50 |
| 7 | F7 | 4.761 | 7.142 | 7.142 | 6.348 |
*Standard deviation, n = 3
Percentage Moisture Loss:
TABLE 9: DATA OF PERCENTAGE MOISTURE LOSS
| S. no. |
Formulation
code |
Percentage moisture loss | |||
| Trial 1 | Trial 2 | Trial 3 | Average | ||
| 1 | F1 | 10.0 | 12.5 | 15.0 | 12.5 |
| 2 | F2 | 7.89 | 10.52 | 10.52 | 9.643 |
| 3 | F3 | 7.50 | 10.0 | 10.0 | 9.166 |
| 4 | F4 | 2.5 | 5.0 | 7.5 | 5.00 |
| 5 | F5 | 2.85 | 2.85 | 5.71 | 3.80 |
| 6 | F6 | 0 | 5.26 | 7.89 | 4.38 |
| 7 | F7 | 6.97 | 9.30 | 11.62 | 9.29 |
Water Vapour Transmission Rate:
TABLE 10: WATER VAPOR TRANSMISSION RATE OF F1 TO F7 FORMULATIONS
| S. no. |
Formulation
code |
Water vapour transmission rate | |||
| Trial 1 | Trial 2 | Trial 3 | Average* | ||
| 1 | F1 | 0.0043 | 0.0046 | 0.0046 | 0.0045 |
| 2 | F2 | 0.0020 | 0.0031 | 0.0028 | 0.0026 |
| 3 | F3 | 0.0026 | 0.0032 | 0.0034 | 0.0030 |
| 4 | F4 | 0.0028 | 0.0023 | 0.0034 | 0.0028 |
| 5 | F5 | 0.0031 | 0.0031 | 0.0028 | 0.0030 |
| 6 | F6 | 0.0037 | 0.0034 | 0.0040 | 0.0037 |
| 7 | F7 | 0.0046 | 0.0043 | 0.0037 | 0.0042 |
Tensile Strength:
TABLE 11: TENSILE STRENGTH OF F1 TO F7 FORMULATIONS
| S. no. |
Formulation
code |
Tensile strength kg/mm2 | |||
| Trial 1 | Trial 2 | Trial 3 | Average* | ||
| 1 | F1 | 3.85 | 3.96 | 3.71 | 3.86 |
| 2 | F2 | 2.85 | 2.96 | 3.07 | 2.98 |
| 3 | F3 | 3.05 | 3.14 | 3.13 | 3.13 |
| 4 | F4 | 3.18 | 3.29 | 3.21 | 3.22 |
| 5 | F5 | 3.22 | 3.31 | 3.28 | 3.27 |
| 6 | F6 | 3.27 | 3.39 | 3.36 | 3.34 |
| 7 | F7 | 3.32 | 3.47 | 3.44 | 3.41 |
Drug Content:
TABLE 12: PERCENTAGE OF DRUG CONTENT OF F1 TO F7 FORMULATION
| S. No. | Formulation Code | Concentration Mean ± SD* (mg/cm2) | % Drug content |
| 1 | F1 | 1.178 ± 0.071 | 98 |
| 2 | F2 | 1.054 ± 0.071 | 87.62 |
| 3 | F3 | 1.083 ± 0.047 | 90.00 |
| 4 | F4 | 1.083 ± 0.053 | 90.25 |
| 5 | F5 | 1.114 ± 0.071 | 91.85 |
| 6 | F6 | 1.114 ± 0.031 | 92.83 |
| 7 | F7 | 1.145 ± 0.035 | 95.41 |
*Standard deviation, n = 3
In-vitro Drug Diffusion Study:
TABLE 13: IN-VITRO DIFFUSION PROFILE OF KETOPROFEN TRANSDERMAL PATCH (F1)
| Time
(h) |
T | Log T | % Cumulative drug release
Mean ± SD* |
Log % cumulative drug release
Mean ± SD* |
% Cumulative drug retained Mean ± SD* | Log % cumulative drug retained Mean ± SD* |
| 0 | 0 | 0 | 0 ± 0 | 0 ± 0 | 100 ± 0 | 2 ± 0 |
| 0.5 | 0.707 | -0.301 | 15.022±0.491 | 1.176±0.013 | 84.978±0.491 | 1.928±0.002 |
| 1 | 1 | 0 | 29.477±0.490 | 1.469±0.006 | 70.522±0.490 | 1.847±0.002 |
| 2 | 1.414 | 0.301 | 42.516±0.850 | 1.628±0.009 | 57.483±0.850 | 1.759±0.006 |
| 3 | 1.732 | 0.477 | 58.389±0.490 | 1.766±0.003 | 41.610±0.490 | 1.619±0.005 |
| 4 | 2 | 0.602 | 64.908±0.491 | 1.812±0.003 | 35.091±0.491 | 1.544±0.005 |
| 5 | 2.236 | 0.698 | 72.845±0.491 | 1.862±0.002 | 27.154±0.491 | 1.433±0.007 |
| 6 | 2.449 | 0.778 | 79.931±0.850 | 1.902±0.004 | 20.068±0.850 | 1.301±0.018 |
| 7 | 2.645 | 0.845 | 87.584±0.850 | 1.942±0.004 | 12.415±0.850 | 1.092±0.029 |
| 8 | 2.828 | 0.903 | 95.526±0.982 | 1.979±0.004 | 4.479±0.982 | 0.615±0.124 |
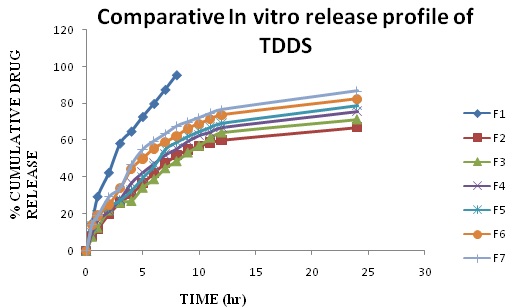
FIG. 5: COMPARATIVE IN-VITRO RELEASE PROFILE OF KETOPROFEN TDDS
DISCUSSION:
Determination of λmax Ketoprofen in pH 7.4 Phosphate Buffer Solution: The solution containing 10 µg/ml was scanned between 200 - 400 nm. The λmax was found to be 245 nm, which indicates the purity of sample drug Ketoprofen.
Preformulation Studies: pH of Ketoprofen was found to be 7.4. Ketoprofen is a weak base, exists in a cationic form at skin pH, and therefore requires permeation enhancers to pass through the skin. The melting point of Ketoprofen was found to be 168–171 °C, as specified in the monograph, which confirms the purity of drug as per B.P.
Determination of Solubility: Ketoprofen is freely soluble in water, phosphate buffer pH 7.4, chloroform, methanol, and acetone. The mean concentration of the drug dissolved in the water was 8.11e-02 g/l.
Determination of Partition Coefficient: The partition coefficient value was experimentally found to be 3.7. The results obtained indicate that the drug possesses sufficient lipophilicity, which fulfills the experiment of formulating the selected drug into a transdermal film.
Determination of Drug-Excipient Compatibility:
FT-IR: Chemical interaction between drug and the polymeric material was studied by using FT-IR. IR spectra of Ketoprofen, HPMC E5, EC. The peaks can be considered as characteristic peaks of Ketoprofen, confirming the purity of the drug observed in IR spectra of Ketoprofen along with polymers.
Evaluation of Transdermal Patches:
Physical Appearance: The prepared transdermal patches were transparent, smooth, uniform and flexible. The method adopted for the preparation of the system was found satisfactory.
Thickness Uniformity: With the help of digital caliper, the thickness of the film was measured at different points, and the average thickness was noted. The result indicates that there was no much difference in the thickness within the formulations and it was found to vary from 0.15 ±0.015 to 0.45± 0.011 mm with low standard deviations. The results are given in Table and order of the thickness of films is F4 < F1 < F7 < F2 < F5 < F6 < F3.
Weight Uniformity: Three different films of the individual batch are weighed, and the average weight was calculated. The dried films were weighed on the digital balance. The films exhibited uniform weight ranging from 0.360 ± 0.020 to 0.416 ± 0.015 g with low standard deviation values. The data are shown in the Table and order of the weight of films is F6 < F2 < F5 < F3 < F4 < F7 < F1.
Folding Endurance: The recorded folding endurance of the films was > 150 times. It means all formulations had good film properties. The data are given in Table and order of the folding endurance is F2 < F3 < F4 < F6 < F5 < F7 < F1. This test is important to check the ability of the sample to withstand folding, which indicates brittleness; less folding endurance indicates more brittleness.
Percentage of Moisture Absorption: The moisture absorption studies carried out in desiccator. All the patches showed the least percentage moisture absorption. The order of the percentage moisture absorption is F2 <F3 <F5 <F4 <F6 <F7 <F1 and the data is presented in the Table. The moisture uptake of the formulations was low, which could protect the formulations from microbial contamination and reduce bulkiness.
Percentage Moisture Loss: The moisture loss studies were carried out at 80-90% relative humidity. All the patches showed the least percentage moisture loss. The order of the percentage moisture loss is F5< F6< F4< F3< F7< F2< F1 and the data is presented in Table. The small moisture content in the formulations helps them to remain stable and from being a completely dried and brittle film.
Water Vapor Transmission Rate: The water vapor transmission rates of different formulations were evaluated, and the results are shown in Table. Ketoprofen patches containing HPMC alone showed higher WVTR as compared to the formulations containing EC. This may be due to the HPMC, which is more hydrophilic than EC, which is less permeable to water vapor. Formulation F7 showed highest WVTR whereas F3 showed lowest WVTR.
Tensile Strength: The tensile strength measures the ability of a patch to withstand rupture. Presence of dibutyl phthalate and dimethyl sulfoxide has shown good tensile strength. Both the combination show significant tensile strength. The mean value was found to vary between 2.98 ± 0.110 to 3.86 ± 0.125 kg/mm2. The tensile strength results indicate the strength of the film and the risk of film cracking. But, no sign of cracking in prepared transdermal films was observed, which might be attributed to the addition of the plasticizer. The results of tensile strength are shown in Table.
Drug Content: For the various formulations, prepared drug content was found to vary between 1.054 ± 0.071 mg to 1.178 ± 0.071 mg. The cumulative percentage drug permeated and percentage drug retained by the individual patch in the in-vitro skin permeation studies were based on the mean amount of drug present in the respective patch. Drug distribution was found to be uniform in the polymeric films, and data are given in Table.
In-vitro Drug Diffusion Study: The in-vitro release profile is a valuable tool that predicts in advance how a drug will behave in-vivo. Release studies are required for predicting the reproducibility of rate and duration of drug release. The transdermal therapeutic system of Ketoprofen using a polymeric matrix film, allows one to control the overall release of the drug via an appropriate choice of polymers and their blends. The results of percentage drug release from the prepared medicated transdermal film.
The percentage of drug release at each time interval was calculated and plotted against time. The drug release profile is shown in Fig. 5. The drug release from HPMC (F1) and EC films (F2) was found to 95.526 ± 0.982 % within 8 h and 67.078 ± 1.875% within 24 h, respectively. Among the formulations F3 to F7 which has the varying proportion of HPMC and EC showed the release of 71.224 ± 0.925% to 86.812 ± 0.262%, F7 showed the maximum release of 86.812 ± 0.262% for 24 h due to the presence of higher portions of HPMC which is more porous than EC.
Increase in the concentration of hydrophilic polymer (HPMC), increases the thermodynamic activity of the drug, which results in increased drug release during in vitro studies. Henceforth formulation F7 was found to be satisfactory as it fulfills the requirements of better and prolonged drug release. It is well known that the addition of the hydrophilic component to an insoluble film former leads to enhance its release rate constant. This is because dissolution of the aqueous soluble fraction of the polymer matrix leads to the formation of gaseous pores. The formation of such pores leads to decrease in the mean diffusion path length of drug molecules to release into the diffusion medium and hence, to cause a higher release rate.
The release kinetics was evaluated by making by use of zero order, first order, Higuchi’s diffusion and Korsmeyer - Peppas equation. The study of drug release kinetics showed that majority of the formulations were governed by Peppas model and to see whether the drug release is by diffusion, by swelling or by erosion mechanism, the data were plotted according to Higuchi's equation. The release kinetics data are represented in Table. The coefficient of determination indicated that the release data for formulation F1 followed zero order release kinetics with diffusion mechanism, while formulation F2 to F7 followed first order release kinetics with diffusion mechanism. Higuchi equation explains the diffusion release mechanism. The diffusion exponent ‘n’ values were found to be in the range of 0.5 to 1 indicating Non-Fickian mechanism.
CONCLUSION: The following conclusions were drawn from the results obtained. A suitable UV Spectroscopy method for the analysis of Fenoprofen was developed. Ketoprofen showed maximum absorption at wavelength 245nm in isotonic phosphate buffer (pH 7.4) solutions. The R2 value for the standard curve was found to be 0.999, which showed a linear relationship between drug concentrations and absorbance values. The preformulation studies involving description, solubility, melting point, the partition coefficient of the drug were found to be comparable with the standard. Based on all the above preformulation studies the drug was suitable for making the transdermal formulation.
Drug-polymer compatibility studies by FT-IR confirmed their purity and showed no interaction between the drug and selected polymers. Various formulations were developed by using hydrophilic and hydrophobic polymers like HPMC E5 and EC respectively in single and combinations by solvent evaporation technique with the incorporation of penetration enhancers such as dimethyl sulfoxide and dibutyl phthalate as a plasticizer.
Developed transdermal patches possessed the required physicochemical properties such as drug content uniformity, folding endurance, weight uniformity, thickness uniformity, tensile strength, and water vapor transmission rate (WVTR). As HPMC concentration increases showed higher WVTR. Patches exhibited higher tensile strength as the concentration of HPMC was increased.
ACKNOWLEDGEMENT: The authors acknow-ledge the assistance of Dr. Roshan S (Principal, Azad College of Pharmacy, Moinabad) for his help in carrying out the experiments.
CONFLICT OF INTEREST: Nil
REFERENCES:
- Liu L, Fishman M, Kost J and Hicks KB: Pectin-based systems for colon-specific drug delivery via oral route. Biomaterials 2003; 24: 3333-43.
- Abdul B and Bloor J: Perspectives on colonic drug delivery, business briefing. Pharmtech 2003; 185-90.
- Cheng G, Jou MJ, Sun J, Hao XU and He YX: Time- and pH dependent colon-specific drug delivery for orally administered diclofenac sodium and 5-amino salicylic acid. World J Gastroenterol 2004; 10(12): 1769-74.
- Krishnaiah YSR and Satyanarayana S: Advances in controlled and novel drug delivery. New Delhi: CBS Publishers and Distributors, Edition 1st, 2001: 89-119.
- Sarasija S and Hota A. Colon-specific drug delivery systems. Ind J Pharm Sci 2000; 62(1): 1-8.
- Gradowski T: Principles of anatomy and physiology. New York: John Wiley & Sons, Edition 10th, 2002: 866-73.
- Ram Prasad YV, Krishnaiah YSR and Satyanarayana S: Trends in colonic drug delivery: a review. Ind Drugs 1995; 33(1): 1-10.
- Kumar R, Patil MB, Patil RS and Paschapur SM: Polysaccharides based colon-specific drug delivery: a review. Int J Pharm Tech Res 2009; 1(2): 334-46.
- Maestrelli F, Cirri M, Corti G, Mennini N and Mura P: Development of enteric- coated calcium pectinate microspheres intended for colonic drug delivery. Eur J Pharm Biopharm 2008; 69: 508-18.
- Asghar LFA and Chandran S: Multiparticulate formulation approach to colon-specific drug delivery: current perspectives. J Pharm Pharm Sci 2006; 9(3): 327-38
- Rubenstein A: Colonic drug delivery. Drug Discov Today Technol 2005; 2(1): 33-7.
- Rubinstein A: Natural polysaccharides as targeting tools of drugs to the human colon. Drug Dev Res 2000; 50: 435-9.
- Jose S, Dhanya K, Cinu TA, Litty J and Chacko AJ: Colon targeted drug delivery: different approaches. J Young Pharm 2009; 1(1): 13-9.
- Chourasia MK and Jain SK: Pharmaceutical approaches to colon targeted drug delivery systems. J Pharm Pharm Sci 2003; 6(1): 33-66.
How to cite this article:
Zakir S, Banu SK, Fatima SN, Jahan T, Firdous W, Sireesha P, Roshan S and Mahammed NL: Formulation and evaluation of transdermal patches of ketoprofin by using different polymers. Int J Pharmacognosy 2015; 2(7): 342-50. doi link: http://dx.doi.org/10.13040/ IJPSR.0975-8232.IJP.2(7).342-50.
This Journal licensed under a Creative Commons Attribution-Non-commercial-Share Alike 3.0 Unported License.
Article Information
5
342-350
768
1432
English
IJP
S. Zakir*, S. K. Banu, S. N. Fatima, T. Jahan, W. Firdous. P. Sireesha. S. Roshan and N. L. Mahammed
Azad College of Pharmacy, Moinabad, R.R. District, Telangana, India
sireesha.panditha@gmail.com
17 May 2015
28 June 2015
28 July 2015
10.13040/IJPSR.0975-8232.IJP.2(7).342-50
31 July 2015