HPTLC METHOD FOR QUANTIFICATION OF ELLAGIC ACID IN IN-VIVO AND IN-VITRO SAMPLES OF WOODFORDIA FRUTICOSA (LINN.) KURZ
HTML Full TextHPTLC METHOD FOR QUANTIFICATION OF ELLAGIC ACID IN IN-VIVO AND IN-VITRO SAMPLES OF WOODFORDIA FRUTICOSA (LINN.) KURZ
Neha Grover, RishiKesh Meena * and Vidya Patni
Department of Botany, University of Rajasthan, Jaipur - 302004, Rajasthan, India.
ABSTRACT: Realising the immense medicinal values of secondary metabolites in drug formulations, the present study was conducted on an important sec metabolite i.e., ellagic acid (tannin) in in-vivo (leaf) and in-vitro callus tissues of Woodfordia fruticosa a much used medicinally important plant. The present method provided a quick and easy approach for the detection and quantitation of biomarker ellagic acid. Qualitative analysis showed the presence of ellagic acid in both in-vivo and in-vitro (callus) samples of Woodfordia fruticosa. Analytical method high-performance thin-layer chromatography (HPTLC) was developed for the quantification of ellagic acid in in-vivo and in-vitro samples of the various solvent systems tried, the system containing toluene-ethyl acetate-formic acid-methanol (3:3:0.8:0.2 v/v) gave the best resolution of ellagic acid (Rf 0.65) from the other components of the sample extracts, and enabled their simultaneous quantification. Quantitative evaluation of the plate was performed in the remission/absorption mode at 280 nm by the use of a TLC Scanner III CAMAG. The amount of ellagic acid was estimated to be about 0.21% w/w for leaf powder and 1.75% w/w for callus powder. The presence of isolated ellagic acid was confirmed by the superimposable IR spectra of isolated and authentic samples of ellagic acid. The estimated ellagic acid values for the two extracts indicate that Woodfordia fruticosa is the richer source of ellagic acid and that the plant is a promising model for the extraction of ellagic acid as it is present in appreciable quantities in both plant extracts.
| Keywords: |
Ellagic acid, Woodfordia fruticosa, HPTLC, Extraction, Isolation
INTRODUCTION: Woodfordia fruticosa (L.) Kurz. (Fire flamed bush), commonly called as Dhavari, Dhatki, etc. is an important plant of India with vast medicinal properties and belongs to the family Lythraceae. Flowers of this plant are the most effective fermentation agents in ayurvedic medicines. It is used both internally as well as externally.
The dried flowers of this plant are reported to be used for the treatment of hemorrhoids, dysentery, diarrhoea, liver diseases, piles, disorders of mucous membranes, leucorrhoea, menorrhagia, ulcers, wounds, burning sensations, skin diseases, fever, headache, herpes, etc. It possesses antibiotic activity, sedative properties, anti-tumor activity, antipyretic, and anti-inflammatory activity as well.
It contains a high amount of medicinally important bioactive compounds/secondary metabolites like ellagic acid, gallic acid, quercetin and myricetin glycosides, β-sitosterol, cyanidin-3.5-diglucoside, pelargonidin-3, 5, diglucoside, octacosanol, chrysophenol -8-O-β-D-glucopyranoside, Wood-fordin, etc.
The active principles in medicinal plants are chemical compounds known as secondary plant products. Medicinal plants are generally known as “chemical goldmines” as they contain natural chemicals, which are acceptable to human and animal systems. The secondary metabolites have high economic and pharmaceutical importance, and the industries are deeply interested in a large variety of chemical substances being produced by plants due to their lesser toxicity.
Tannins are natural compounds widely distributed in the plant kingdom. The function of tannins is the defense system of plants against microbial and animal attacks due to their astringent capacity and the ability to form complexes with proteins and polysaccharides 1, 2. Tannins are secondary metabolites of plants. It is generally accepted that considering their sugar content, polymerization and esterification degrees they are divided into three groups: condensed tannins, hydrolyzable tannins and complex tannins.
Among all phytochemicals, ellagic acid (EA) has been receiving the most attention because of its wide array of biological properties, such as radical scavenging, chemopreventive, antiviral, and antibacterial properties 3, 4.
The anti-proliferative and antioxidant properties of ellagic acid have prompted research into its potential health benefits. It possesses anti-oxidant, anti-mutagenic, and anticancer properties.
Ellagic acid (EA) is one of the naturally occurring phenolic acids, a diverse class of bioactive polyphenols produced by plants. It is a breakdown product of larger and more complex polyphenols, the ellagitannins (ETs), and is mostly found in plant cell vacuoles in free and covalently bound forms, namely EA or EA derivatives and ETS, respectively 5, 6. EA and its derivatives display a wide range of biological and physiological activities, most notably antioxidant, anti-inflammatory, antiglycation, estrogenic and anti-estrogenic, antimicrobial, as well as prebiotic activities, which may contribute to human health7, 8.
As ellagic acid (tannins) is considered as an active ingredient of the plant, the present study was undertaken for isolation, identification, and quantitative estimation of ellagic acid content from various plant parts and callus tissues of Woodfordia fruticosa.
MATERIAL AND METHODS:
Plant Material: The samples for isolation of ellagic acid were collected from the Haridwar, Rishikesh, and also from Jhadol (Udaipur) and voucher specimens deposited in the Rajasthan University’s Herbarium (RUBL20635). They were established in the nursery of the Department of Botany, University of Rajasthan, and used in the study.
Preparation of Extract:
In-vivo Plant Parts: Mature plant parts (leaves) of Woodfordia fruticosa were collected and were washed with tap water to remove dust and dried in the shade.
In-vitro Tissue Culture: Nodal stem explants of Woodfordia fruticosa were inoculated onto MS medium supplemented with IBA (1.0 mg/l) and BAP (0.5 mg/ l). Six-week-old callus tissue was dried in an oven at 100 °C for 15 min. to inactivate enzymes, followed by 60 °C till a constant weight was achieved. Tissue samples were powdered and used for extraction. The in-vivo and in-vitro samples of the plant were dried in the dark at room temperature, powdered and extracted by Soxhlet extraction method using methanol as solvent. Afterward, the extract was filtered using Whatman filter paper, and then the solvent was distilled under reduced pressure in a rotary vacuum evaporator until the extracts became dry.
Reagents and other Materials: Ellagic acid (Sigma Aldrich), Toluene, Ethyl acetate, Formic acid, and Methanol (all Reagents of analytical grade, E-Merck) and silica gel F254 precoated TLC aluminum plates (E-Merck).
Preparation of Standard and Sample Solutions: Ellagic acid 10 mg was accurately weighed into a 10 ml volumetric flask, dissolved in 10 mL methanol, and the solution was made up to 10 mL with the same solvent (1 mg/mL). The Soxhlet extracted and dried methanolic extract was accurately weighed (100 mg) into a 10 mL volumetric flask, dissolved in methanol, and then the solution was filtered through Whatman filter paper no. 42, and the filtrate was made up to the mark with methanol.
Development of HPTLC Technique: The samples were spotted in the form of bands with camag microlitre syringe on a TLC A1 precoated silica gel plates 60 F 254 10 cm × 10 cm with 0.2 mm thickness, E. Merck using camag linomat V applicator. 10 µl of Test Solution and Standard solution was applied on a precoated layer maintaining a distance of 10 mm from the bottom edge, band length 8 mm, the distance between tracks 20 mm and distance from the side 15 mm. Application position 10 mm with solvent position 80 mm. Measurement mode was UV absorbance/reflectance with scanning wavelength 280 nm, tank saturation 10 min with filter paper. Total no. of tracks was 6 with the position of first track X 15.0 mm, distance between tracks 14.0 mm , scan start position Y 5.0 mm , scan end position Y 85.0 mm , slit dimensions 6.00 × 0.30 mm, micro with scanning speed 20 mm/s and data resolution 100 μm/step. The detector was used as an automatic mode with sensitivity 33%, Peak threshold minimum slope-5, peak threshold minimum height-5 AU, peak threshold minimum area-50, peak threshold maximum height-990 AU.
The plates were developed in a solvent system in CAMAG glass twin trough chamber (20 × 10 cm) with S. S. Lid. It was developed up to 80 mm in the twin trough chamber using the mobile phase, dried with the help of air drier, and subjected for TLC scanning at 280 nm.
Ellagic Acid Estimation in W. Fruticosa:
| Stationary phase | : | Silica gel F254 plates |
| Mobile phase | : | Toluene-ethyl acetate-formic acid-methanol (3:3:0.8:0.2) |
| Standard | : | Ellagic acid 1 mg/ml |
| Sample
|
: | W. fruticosa in-vivo and in-vitro plant extract 10 mg/ml |
| Development distance | : | 80 mm |
| Scanning wavelength | : | 280 nm |
| Photo documentation | : | In white light |
| Measurement mode | : | Tungsten lamp. (after derivatization with AS) |
Simultaneous Quantification of Ellagic Acid in Different Samples: A 10 µL volume of each of the suitably diluted sample solutions was applied in triplicate on TLC plates. The standard zones were quantified by linear scanning at 280 nm by the use of a TLC scanner III camag. Data of peak height and peak area of each spot was recorded. The calibration curve was prepared by plotting concentration (µg/spot) versus peak area corresponding to each spot. So, the amount of ellagic acid in different samples was calculated using the respective calibration curve. The plates were developed and scanned at 280 nm. The peak areas and absorption spectra were recorded. The concentration of the metabolite in the sample was calculated by considering the sample initially taken and dilution factors. Quantitative evaluation of the plate was performed in the remission/absorption mode at 280 nm, with the following conditions slit width 6.00 × 0.030 mm, Micro, micro scanning speed 20 mm/s, and data resolution 100 μm/step. (Executed by-Arbro pharmaceuticals, Delhi).
RESULTS: The various solvent systems tried, the system containing toluene-ethyl acetate-formic acid-methanol (3:3:0.8:0.2 v/v) gave the best resolution of ellagic acid (Rf65) from the other components of the sample extracts, and enabled their simultaneous quantification. The purity of ellagic acid bands in the sample extracts was confirmed by comparing the absorption spectra at the start, middle, and end position of the bands. Further, bands were detected by spraying with 5% methanolic ferric chloride solution, after which the two compounds appeared as dark blue bands.
The TLC fingerprints image is shown in Fig. 1. Under the chromatographic conditions described above, the Rf value of ellagic acid was determined to be approximately 0.63 for leaves and callus of W. fruticosa. The Rf’s obtained for the said plant extracts closely replicate the Rf’s found for working standard of ellagic acid, thus making it a significant fingerprint parameter. The chromatograms of standard ellagic acid, i.e., track peaks, are shown in Fig. 2A and that of ellagic acid in leaves and callus of W. fruticosa are shown in Fig. 2B, and C) . The respective Rf’s obtained for each track are shown in Table 1. The 3D spectra of all tracks scanned at 280 nm are shown in Fig. 3A three-dimensional views enhance the visible similarities amongst all spectral tracks at a selected wavelength, which in the present study was 280 nm at different vertices thus bringing out the desired fingerprints. The 3D spectra obtained from the present study has brought out the spectra for all tracks viewed together and are suggestive of similarities between the test tracks and the standard tracks, also elucidating the strong presence of the biomarker in the plant extracts.
The Rf value of standard ellagic acid was found to be 0.65 and peak area 304.7 Fig. 2A. Leaf and callus extract showed nine and ten peaks respectively, the seventh peak in leaf and sixth peak in callus with Rf value 0.63 was coinciding with standard Rf value, and its peak area was 129.4 and 1077.7 respectively Fig. 2B and C. The amount of ellagic acid was estimated to be about 0.21 % w/w for leaf powder and 1.75 % w/w for callus powder Table 2.
DISCUSSION: Ellagic acid is a hydrolyzable tannin and is a Benzopyran derivative, that has many potential uses in medicine. It has been found to be hepatoprotective, antioxidant, ant mutagenic, and antimicrobial.
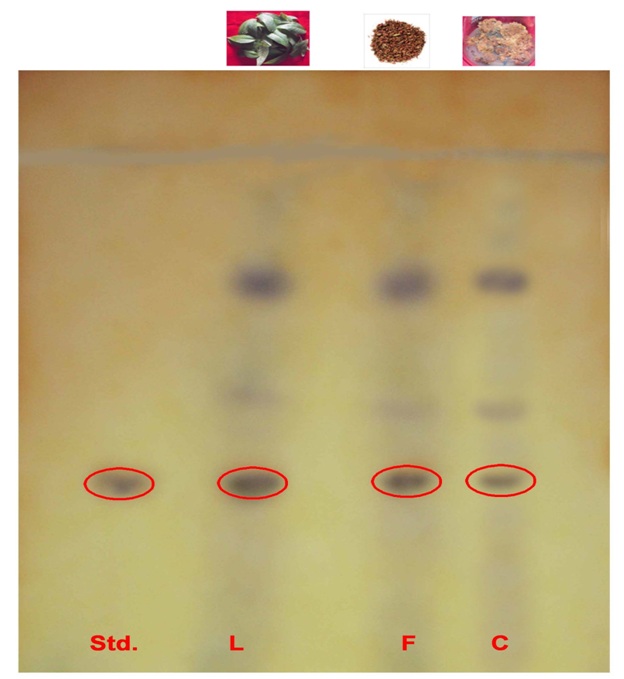
FIG. 1: TLC PLATE SHOWING PRESENCE OF ELLAGIC ACID IN ISOLATED SAMPLES OF WOODFORDIA FRUTICOSA L = leaf, F = flower, C = callus, Std. = standard
In the present study, the bioactive secondary metabolite ellagic acid was identified and isolated from all in-vivo and in-vitro tissues tested. The purity of ellagic acid bands in the sample extracts was confirmed by comparing the absorption spectra at the start, middle, and end position of the bands. The Rf value of standard ellagic acid was found to be 0.65 and peak area 304.7. Leaf and callus extract showed nine and ten peaks respectively, the seventh peak in leaf and sixth peak in callus with Rf value 0.63 was coinciding with standard Rf value, and its peak area was 129.4 and 1077.7 respectively. Quantitative evaluation of the plate was performed in the remission/absorption mode at 280 nm by the use of a TLC scanner III camag. The amount of ellagic acid was estimated to be about 0.21% w/w for leaf powder and 1.75% w/w for callus powder. Similarly, results were obtained by many workers viz 9, 10, 11.
Among all phytochemicals, ellagic acid (EA) has been receiving the most attention because of its wide array of biological properties, such as radical scavenging, chemopreventive, antiviral, and antibacterial properties 3. Ellagic acid (EA) is a phenolic compound that exhibits both anti-mutagenic and anti-carcinogenic activity in a wide range of assays in-vitro and in-vivo 12, 13. Ellagic acid is a great cancer fighter.
Ellagic acid has also been said to reduce heart disease, birth defects, liver problems, and to promote wound healing 14.
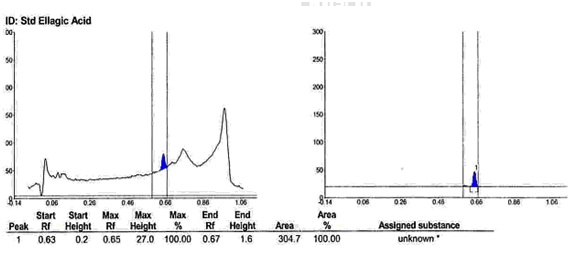
FIG. 2A: CHROMATOGRAM OF STANDARD ELLAGIC ACID
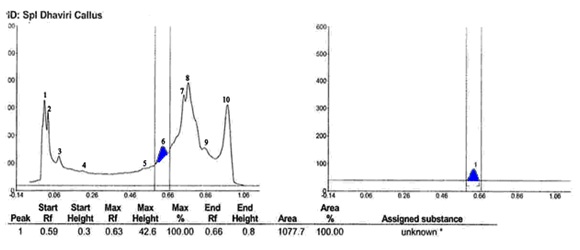
FIG. 2B: CHROMATOGRAM OF ELLAGIC ACID IN CALLUS
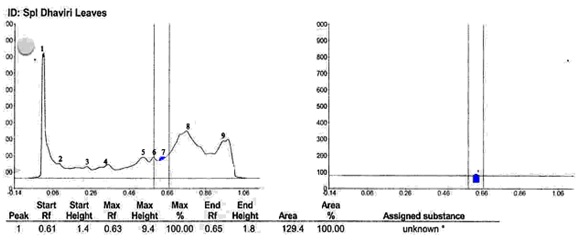
FIG. 2C: CHROMATOGRAM OF ELLAGIC ACID IN LEAVES
CONCLUSION: In conclusion, we can say that the present method provided a quick and easy approach for the detection and quantitation of biomarker ellagic acid in Woodfordia fruticosa. Qualitative analysis showed the presence of ellagic acid in both in-vivo and in-vitro (callus) samples of Woodfordia fruticosa. The amount of ellagic acid was estimated to be about 0.21% w/w for leaf powder and 1.75% w/w for callus powder. The estimated ellagic acid values for the two extracts indicate that Woodfordia fruticosa is the richer source of ellagic acid and that the plant is a promising model for the extraction of ellagic acid as it is present in appreciable quantities in both plant extracts. The proposed HPTLC method for simultaneous monitoring and quantification of the bioactive compound, viz. ellagic acid, is simple, precise and accurate and can be used for their quantification in plant materials and also in routine quality control of herbal drugs.
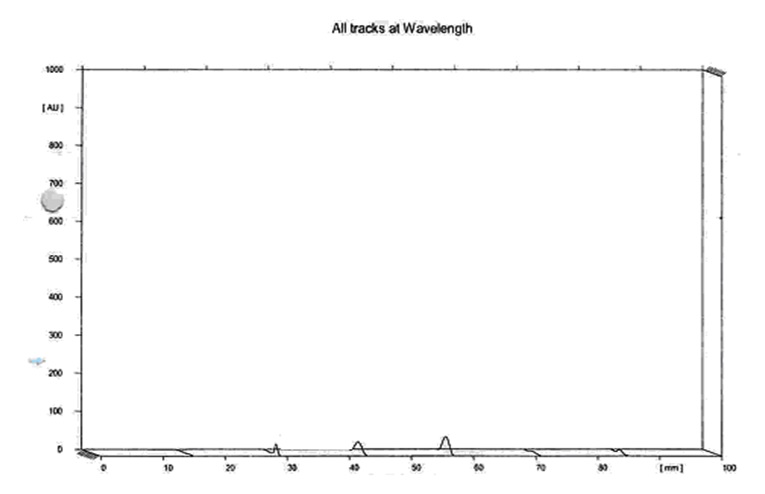
FIG. 3A: 3-D SPECTRA OF ALL TRACKS OF ELLAGIC ACID SAMPLE AND STANDARD SCANNED AT 280 nm
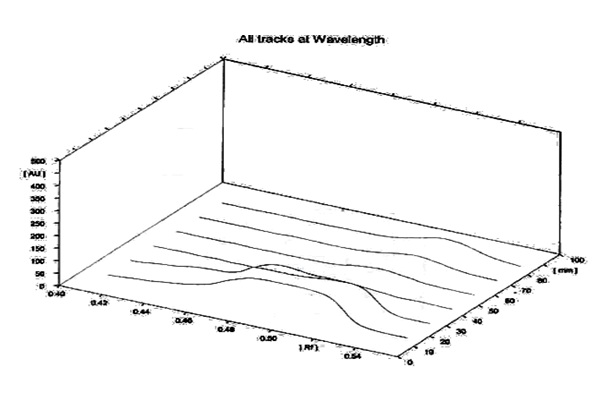
FIG. 3B: 3-D SPECTRA OF ALL TRACKS OF β-SITOSTEROL SAMPLE AND STANDARD SCANNED AT 580 nm
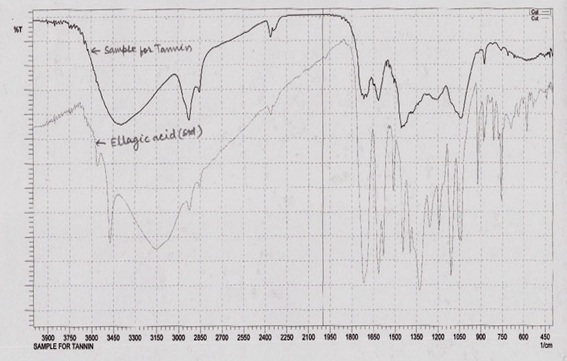
FIG. 4: SUPERIMPOSED IR SPECTRA OF ISOLATED TANNINS ELLAGIC ACID AND STANDARD TANNINS
TABLE 1: RF RANGE AND MAXIMUM RF (PEAK) OF TRACKS CONTAINING ELLAGIC ACID STANDARDS AND IN-VIVO AND IN-VITRO PLANT SAMPLES
| Tracks | Start position | Maximum Rf | End
position |
| Track1 (Std. EA) | 0.61 | 0.63 | 0.67 |
| Track 2 (Std. EA) | 0.63 | 0.65 | 0.67 |
| Track3 (Spl callus) | 0.60 | 0.64 | 0.67 |
| Track 4 (Spl callus) | 0.59 | 0.63 | 0.66 |
| Track 5 (Spl leaves) | 0.60 | 0.62 | 0.63 |
| Track 6 (Spl leaves) | 0.61 | 0.63 | 0.65 |
TABLE 2: CALCULATION OF ELLAGIC ACID CONTENT FOUND IN DIFFERENT HERBAL RAW MATERIALS BY HPTLC METHOD
| Sample | Leaf extract | Callus extract |
| Area of sample | 129.4 | 1077.7 |
| Area of standard | 304.7 | 304.7 |
| Wt. of standard (mg) | 10.1 | 10.05 |
| Wt. of sample (mg) | 1002.4 | 1002.1 |
| Standard potency | 99.00% | 99.00% |
| Result in % | 0.21 % | 1.75% |
ACKNOWLEDGEMENT: The authors are thankful to Arbro Pharmaceuticals for their co-operation in executing the HPTLC procedure.
CONFLICTS OF INTEREST: The author declares that they have no conflicts of interest.
REFERENCES:
- Swain T and Bate-Smith EC: Flavonoid compounds in comparative biochemistry. MAM Florkin New-York Academic Press 1962; 3: 755-09.
- Antonio A, Christopher A, Lilia AP, Ernesto F and Aguilar Cristóbal N: Microbial production of ellagic acid and biodegradation of ellagitannins. Appl Microbiol Biotechnol 2008; 78: 189-99.
- Xu YM, Deng JZ and Ma J: DNA damaging activity of ellagic acid derivatives. Bio Med Chem 2003; 11: 1593-6.
- Patel C, Shah S, Shah D, Kalyankar G and Lodha S: A review on ellagic acid as a natural antioxidant. Critical Review in Pharmaceutical Sci 2015; 4(4): 14-27.
- Atkinson CJ, Dodds PAA, Ford YY, Le JM, Taylor JM, Blake PS and Paul N: Effects of cultivar, fruit number and reflected photo synthetically active radiation on Fragaria x ananassa productivity and fruit ellagic acid and ascorbic acid concentration. Annals of Botany 2006; 97(3): 429-41.
- Shahidi F and Yeo JD: Insoluble-bound phenolics in food. Molecules 2016; 21: 1216.
- Landete JM: Ellagitannins, ellagic acid and their derived metabolites: a review about source, metabolism, functions and health. Food Research Inter 2011; 44: 1150-60.
- Selva M, Carole T, John S, Xingqian Y and Jun SY: Ellagic acid in strawberry (Fragaria spp.) biological, technological, stability and human health aspects. Food Quality and Safety 2017; 1(4): 227-52.
- Kumar VK, Kumar PS, Rajan M, Kumar AV, Boppana R, Reddy PS and Alzeber HFH: Qualitative phytochemical analysis of Bauhinia tomentosa flower by HPTLC. Journal of Pharmacy Research 2011; 4(9): 2868-80.
- Vardhan MS, Tamizhmani T, Krishna SR, Krishna KVVS and Sankar KG: HPTLC method development and validation for the simultaneous estimation of ellagic acid and quercetin in marketed polyherbal formulations. International Journal of Research in Pharmaceutical and Biomedical Sciences 2012; 3(2): 504-09.
- Devi YM, Wesely EG and Johnson M: Chromatographic studies on the tannins of Aerva lanata (L.) Juss. ex schultes. IOSR Journal of Pharmacy 2012; 2(1): 41-51.
- Festa F, Aglitti T, Duranti G, Ricordy R, Perticone P and Cozzi R: Strong antioxidant activity of ellagic acid in mammalian cells in-vitro revealed by the comet assay. Anticancer Research 2001; 21: 3903-08.
- Renata N: Determination of ellagic acid in pseudo fruits of some species of roses. Acta Poloniae Pharmaceutica Drug Research 2006; 63(4): 289-92.
- Ahn D, Putt D, Kresty L, Stoner GD, Fromm D and Hollenberg PF : The effect of dietary ellagic acid on rat hepatic and esophageal mucosal cytochrome p 450 and phase II enzymes. Carcinogenesis 1996; 17: 821-28.
How to cite this article:
Grover N, Meena RK and Patni V: HPTLC method for quantification of ellagic acid in in-vivo and in-vitro samples of Woodfordia fruticosa (Linn.) kurz. Int J Pharmacognosy 2020; 7(1): 29-35. doi link: http://dx.doi.org/10.13040/IJPSR.0975-8232.IJP.7(1).29-35.
This Journal licensed under a Creative Commons Attribution-Non-commercial-Share Alike 3.0 Unported License.