DETERMINATION OF FLURBIROFEN IN PHARMACEUTICAL PREPARATIONS BY FIRST- ORDER DERIVATIVE SPECTROPHOTOMETRY METHOD
HTML Full TextDETERMINATION OF FLURBIPROFEN IN PHARMACEUTICAL PREPARATIONS BY FIRST-ORDER DERIVATIVE SPECTROPHOTOMETRY METHOD
Emrah Alkan and Bilal Yilmaz *
Department of Analytical Chemistry, Faculty of Pharmacy, Ataturk University, 25240, Erzurum, Turkey.
ABSTRACT: Flurbiprofen is a new non-steroidal anti-inflammatory agent, one of the propionic acid groups, which has significant anti-inflammatory, analgesic, and antipyretic properties. Clinically, it is used for the treatment of rheumatoid arthritis, degenerative joint disease, osteoarthritis, ankylosing spondylitis, acute musculoskeletal disorders, low back pain, and allied conditions. In this study, the first-order derivative spectrophotometry method was developed for the determination of flurbiprofen in pharmaceutical preparations. In the first derivative spectrophotometry, absorbance values were measured at 213, 233 and 260 nm. Parameters such as linearity, precision, accuracy, specificity, stability, limit of detection and limit of quantitation were studied according to the International Conference on Harmonization Guidelines. A calibration curve was linear between the concentration ranges of 1-14 μg ml-1. Within- and between-day precision values for flurbiprofen were less than 4.95%, and accuracy (relative error) was better than 3.67%. The mean recovery value of flurbiprofen was 100.9% for pharmaceutical preparations. The developed method was successfully applied to tablet formulations and the results were compared statistically with each other.
| Keywords: |
Flurbiprofen, First-order derivative spectrophotometry, Validation, Pharmaceutical preparation
INTRODUCTION: Non-steroidal anti-inflammatory drugs (NSAIDs) are among the most commonly prescribed agents worldwide to treat a variety of pain-related conditions, including arthritis and other rheumatic diseases. Also, epidemiological studies have shown that long-term use of NSAIDs reduces the risk of developing Alzheimer’s disease and delays its onset 1-3. Flurbiprofen Fig. 1 is used for the treatment of rheumatoid arthritis, degenerative joint disease, osteoarthritis, unclosing spondylitis, acute musculo-skeletal disorders, low back pain, and allied conditions 4-7.
It contains a fluorine atom in its molecular structure, producing better effects at a lower therapeutic dose and with less adverse effects compared with similar drugs.
FIG. 1: CHEMICAL STRUCTURE OF FLURBIPROFEN
Several methods have been reported for the determination of flurbiprofen including High-Performance Liquid Chromatography (HPLC) 8-19 and Liquid Chromatography-Mass Spectrometry (LC-MS) 20. Over the last 20 years, several HPLC methods using UV or fluorescence detection have been reported for the estimation of flurbiprofen either alone or together with their metabolites in plasma/serum 8-13, in urine 14-18 and ocular fluids 19. USP 2000 21 and BP 1993 22 both have recommended HPLC method for analysis of pure flurbiprofen and in dosage form (tablet and ophthalmic drops). Both the methods recommended the use of a mobile phase of acetonitrile-water-glacial acetic acid (60:35:5) at a flow rate of 1 mL/min. IP 1996 23 has suggested a titrimetric method for flurbiprofen estimation.
However, to our knowledge, there is no individual first-order derivative spectrophotometric method for the determination of flurbiprofen in pharma-ceutical preparations in literature. Derivative spectrophotometry is an analytical technique of great utility for extracting both qualitative and quantitative information from spectra composed of unresolved bands, and for eliminating the effect of baseline shifts and baseline tilts. It consists of calculating and plotting one of the mathematical derivatives of a spectral curve 24. Last year, this technique rapidly gained ground in the application in the analysis of pharmaceutical preparations.
We wanted to develop a new spectrophotometric method for the determination of flurbiprofen in pharmaceutical preparations without the necessity of sample pre-treatment. After developing the first-order derivative spectrophotometric method was also carried out and all optimization parameters were also considered. Also, the developed methods were applied to commercial preparations (Majezik, Frolix, Maximus, Zero-P, and Fortune) as a tablet. The results obtained were statistically compared.
MATERIALS AND METHODS:
Chemicals: Flurbiprofen was obtained from Sigma (St. Louis, MO, USA). Majeski, Frolix, Maximus, Zero-P and Fortune tablets (100 mg flurbiprofen) were obtained the pharmacy (Erzurum, Turkey).
Instrument: A Thermospectronic double-beam UV - Visible spectrophotometer (HElIOSβ, Thermo Spectronic, Cambridge, UK) with the local control software was used. First-order derivative spectra of reference and sample solutions were recorded in 1cm quartz cells at a scan speed of 600 nm min-1, a scan range of 190-320 nm and fixed slit width of 2 nm.
Preparations of the Standard and Quality Control Solutions: The stock standard solution of flurbiprofen was prepared in acetonitrile to a concentration of 100 µg ml-1 and kept stored at -20 °C in dark glass flasks. Working standard solutions were prepared from the stock standard solutions. A calibration graph was constructed in the range of 1, 2, 4, 6, 8, 10, 12 and 14 µg ml-1 for flurbiprofen (n=6). For quality control samples containing concentration 3, 9 and 13 µg ml-1 of flurbiprofen, the stock solution was diluted with acetonitrile.
Assay Sample Preparation: The average capsule mass was calculated from the mass of tablets of Majezik, Frolix, Maximus, Zero-P, and Fortune (100 mg flurbiprofen tablet, which was composed of flurbiprofen and some excipients). They were then finely ground, homogenized and a portion of the powder was weighed accurately, transferred into a 100 mL brown measuring flask and diluted to scale with acetonitrile. The mixture was sonicated for at least 10 min to aid dissolution and then filtered through a Whatman 42 paper. An appropriate volume of filtrate was diluted further with acetonitrile so that the concentration of flurbiprofen in the final solution was within the working range and then recorded against acetonitrile.
Data analysis: All statistical calculations were performed with the Statistical Product and Service Solutions (SPSS) for Windows, version 10.0. Correlations were considered statistically significant if calculated P values were 0.05 or less.
RESULTS AND DISCUSSION:
Method Development: The derivative wavelength difference (Δλ) n values (smoothing factor). Generally, the noise decreases by increasing. Optimal wavelength range should be chosen since the broad peaks become sharper, the ratio of signal/noise elevates, and the sensitivity of the method increases by controlling the degree of low pass filtering or smoothing. Therefore, a series of n values (n=1-9) were tested in the first-order derivative spectra of flurbiprofen in acetonitrile. Optimum results were obtained in the measuring wavelength range 190-320 nm, n=5 (Δλ=17.5 nm) for the first-order derivative spectrophotometric method.

FIG. 2: FIRST-ORDER DERIVATIVE SPECTRUMS OF STANDARD SOLUTIONS OF FLURBIPROFEN
Fig. 2 presents the overlay of first-order ultraviolet spectra of standard flurbiprofen samples in acetonitrile. As demonstrated in Fig. 2, the maximum peak is represented at 233, and minima peaks are shown at 213 and 260 nm. As no difference was observed between the spectra of flurbiprofen standard and tablet solutions and in the maximum and minima wavelengths of all spectra, it was suggested that the developed methods allowed complete elimination of the background absorption due to the tablet excipients at the chosen wavelengths both in first-order derivative spectra of flurbiprofen.
Method Validation:
Linearity: For quantitative analysis of flurbiprofen, the calibration curves were plotted for each spectrophotometric method over the concentration ranges cited. The peak to zero methods for calibration curve in the first-order derivative spectrophotometric method was used. The linearity ranges of all spectrophotometric method were found to be 1-14 µg ml-1. The statistical parameters and regression equations which were calculated from the calibration curves along with the standard error of the slope and the intercept are given in Table 1.
TABLE 1: RESULTS OF REGRESSION ANALYSIS OF FLURBIPROFEN
| Wavelength l: nm | 213 | 233 | 260 |
| Linearity mg ml-1 | 1-14 | 1-14 | 1-14 |
| Linear regression | D1=0.8725x+0.3947 | D1=0.2547x-0.1097 | D1=0.2754x+0.0104 |
| Sa | 2.68×10⁻² | 3.18×10⁻² | 3.74×10⁻² |
| Sb | 5.62×10⁻³ | 7.98×10⁻³ | 6.26×10⁻³ |
| Coefficient of correlation (r) | 0.9948 | 0.9973 | 0.9981 |
| Sr | 4.65×10⁻³ | 3.76×10⁻³ | 2.87×10⁻³ |
Sa: Standard deviation of intercept of the regression line, Sb: Standard deviation of the slope of the regression line, Sr: Standard deviation of coefficient of correlation.
Limits of Detection (LOD) and Quantitation (LOQ): The LOD and LOQ of flurbiprofen by the proposed methods were determined using calibration standards. LOD and LOQ values were calculated as 3.3 σ/S, and 10 σ/S, respectively, where S is the slope of the calibration curve and σ is the standard deviation of y-intercept of regression equation (n=6) 25 Table 1.
Specificity: Comparison of the first-order derivative spectrum of flurbiprofen in standard and drug formulation (Majezik, Frolix, Maximus, Zero-P and Fortine tablet) solutions show that the wavelengths of maximum and minimum absorbance do not change Fig. 3. According to the results obtained, the first-order the derivative spectrophotometric method can access the flurbiprofen in the presence of excipients, and hence, the method can be considered specific.
Accuracy and Precision: The precision of the analytic method was determined by repeatability (within-day) and intermediate precision (between-day). Three different concentrations which were quality control samples (3, 9, 13 µgml-1) were analyzed six times per day for within-day precision and once daily for three days for between-day precision. Repeatability was ≤3.10% (n=6) and intermediate precision was ≤4.95%, (n=6), respectively Table 2.
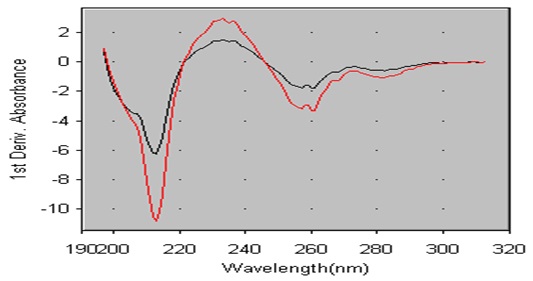
FIG. 3: FIRST-ORDER DERIVATIVE SPECTRUMS OF MAJEZIK TABLET SOLUTIONS CONTAINING FLURBIPROFEN
TABLE 2: PRECISION AND ACCURACY OF FLURBIPROFEN
| Within-day | Between-day | ||||||
| Method | Added
(mg ml-1) |
Found (mg ml-1)
X±SD |
Accuracy | Precision
RSD%a |
Found (mg ml-1)
X±SD |
Accuracy | Precision
RSD%a |
| 1 D213 nm | 3 | 3.07±0.038 | 2.33 | 1.24 | 3.09±0.075 | 3.00 | 2.43 |
| 1 D233 nm | 3 | 3.06±0.048 | 2.00 | 1.57 | 3.07±0.085 | 2.33 | 2.77 |
| 1 D260 nm | 3 | 2.95 ± 0.081 | -1.67 | 2.75 | 3.11±0.154 | 3.67 | 4.95 |
| 1 D213 nm | 9 | 9.11±0.198 | 1.22 | 2.17 | 9.16±0.281 | 1.78 | 3.07 |
| 1 D233 nm | 9 | 9.02±0.192 | 0.22 | 2.13 | 9.13±0.285 | 1.44 | 3.12 |
| 1 D260 nm | 9 | 9.13±0.275 | 1.44 | 3.01 | 9.12±0.289 | 1.33 | 3.17 |
| 1 D213 nm | 13 | 13.12±0.421 | 0.92 | 3.21 | 13.16±0.425 | 1.23 | 3.22 |
| 1 D233 nm | 13 | 13.08±0.416 | 0.62 | 3.18 | 12.89±0.398 | -0.84 | 3.09 |
| 1 D260 nm | 13 | 12.85±0.472 | -1.15 | 3.67 | 13.11±0.462 | 0.84 | 3.52 |
X: Mean, SD: Standard deviation of six replicate determinations, RSD: Relative standard derivation, aAverage of six replicate determinations, Accuracy: (%relative error) (found-added)/added × 100
Recovery: To determine the accuracy of the first-order derivative spectrophotometric method and to study the interference of formulation additives, the recovery was checked at three different concentration levels (2, 6, 10 µg ml-1) and analytical recovery experiments were performed by adding known amount of pure drugs to pre-analyzed samples of commercial dosage form (Majezik, Frolix, Maximus, Zero-P and Fortine tablet). The percent analytical recovery values were calculated by comparing concentration obtained from the spiked samples with actually added concentrations. The mean recovery of the first-order derivative spectrophotometric method was 100.9 Table 3.
Stability: To evaluate the stability of flurbiprofen, standard solutions were prepared separately at concentrations covering the low, medium and higher ranges of calibration curve for different temperature and times. These solutions were stored at room temperature, refrigerator (4 °C) and frozen (-20 °C) temperature for 24 h and 72h. The results were evaluated comparing these measurements with those of standards and expressed as percentage deviation and flurbiprofen was found as stable at room temperature, 4 and -20 °C for at least 72h Table 4.
Ruggedness: In this study, first-order derivative spectrophotometric determination of flurbiprofen was carried out by a different analyst in same instrument with the same standard Table 5. The result showed no statistical differences between different operators suggesting that the developed method was rugged.
TABLE 3: RECOVERY VALUES OF FLURBIPROFEN IN PHARMACEUTICAL PREPARATIONS
| Within-day | Between-day | |||||||
| Commercial Preparation | Method | Added
(mg ml-1) |
Found (mg ml-1)
X±SD |
Recovery
(%) |
RSD
%a |
Found (mg ml-1)
X±SD |
Recovery
(%) |
RSD
%a |
|
Majezik (2 mg ml-1)
|
1 D213 nm | 2 | 1.99±0.031 | 99.6 | 1.56 | 2.06±0.032 | 103.0 | 1.55 |
| 1 D233 nm | 2 | 1.97±0.025 | 98.5 | 1.27 | 2.04±0.041 | 102.0 | 2.01 | |
| 1 D260 nm | 2 | 1.98±0.033 | 99.0 | 1.67 | 2.03±0.038 | 101.5 | 1.87 | |
| 1 D213 nm | 6 | 5.97±0.146 | 99.4 | 2.45 | 6.08±0.142 | 101.3 | 2.34 | |
| 1 D233 nm | 6 | 5.98±0.165 | 99.7 | 2.76 | 6.05±0.152 | 100.8 | 2.51 | |
| 1 D260 nm | 6 | 6.09±0.178 | 101.5 | 2.97 | 5.97±0.171 | 99.5 | 2.86 | |
| 1 D213 nm | 10 | 9.89±0.226 | 98.9 | 2.29 | 9.85±0.211 | 98.5 | 2.14 | |
| 1 D233 nm | 10 | 9.85±0.211 | 98.5 | 2.14 | 10.18±0.147 | 101.8 | 1.44 | |
| 1 D260 nm | 10 | 10.12±0.285 | 101.2 | 2.82 | 10.09±0.256 | 100.9 | 2.54 | |
|
Frolix (2 mg ml-1)
|
1 D213 nm | 2 | 1.96±0.038 | 97.7 | 1.94 | 1.99±0.019 | 99.5 | 0.95 |
| 1 D233 nm | 2 | 1.97±0.028 | 98.5 | 1.42 | 2.04±0.033 | 102.0 | 1.62 | |
| 1 D260 nm | 2 | 2.03±0.067 | 101.6 | 3.30 | 2.03±0.042 | 101.5 | 2.07 | |
| 1 D213 nm | 6 | 5.98±0.129 | 99.7 | 2.17 | 6.08±0.145 | 101.3 | 2.38 | |
| 1 D233 nm | 6 | 5.92±0.132 | 98.7 | 2.22 | 5.96±0.150 | 99.3 | 2.52 | |
| 1 D260 nm | 6 | 6.02±0.148 | 100.3 | 2.46 | 5.97±0.142 | 99.5 | 2.38 | |
| 1 D213 nm | 10 | 10.08±0.276 | 100.8 | 2.74 | 9.98±0.263 | 99.8 | 2.64 | |
| 1 D233 nm | 10 | 9.99±0.256 | 99.9 | 2.56 | 10.13±0.295 | 101.3 | 2.91 | |
| 1 D260 nm | 10 | 9.94±0.194 | 99.4 | 1.95 | 9.97±0.242 | 99.7 | 2.43 | |
|
Maximus (2 mg ml-1)
|
1 D213 nm | 2 | 2.03±0.086 | 101.4 | 4.24 | 1.99±0.076 | 99.5 | 3.82 |
| 1 D233 nm | 2 | 1.98±0.058 | 99.0 | 2.93 | 1.97±0.062 | 98.5 | 3.14 | |
| 1 D260 nm | 2 | 2.04±0.096 | 102.0 | 4.71 | 1.97±0.058 | 98.5 | 2.94 | |
| 1 D213 nm | 6 | 5.98±0.253 | 99.7 | 4.23 | 5.98±0.149 | 99.7 | 2.49 | |
| 1 D233 nm | 6 | 6.04±0.228 | 100.7 | 3.77 | 5.96±0.255 | 99.3 | 4.28 | |
| 1 D260 nm | 6 | 5.92±0.142 | 98.7 | 2.39 | 5.96±0.142 | 99.3 | 2.38 | |
| 1 D213 nm | 10 | 9.88±0.343 | 98.8 | 3.47 | 9.98±0.366 | 99.8 | 3.67 | |
| 1 D233 nm | 10 | 9.98±0.262 | 99.8 | 2.63 | 10.08±0.288 | 100.8 | 2.86 | |
| 1 D260 nm | 10 | 9.94±0.194 | 99.4 | 1.95 | 9.96±0.235 | 99.6 | 2.36 | |
|
Zero-P (2 mg ml-1) |
1 D213 nm | 2 | 1.95±0.066 | 97.4 | 3.38 | 1.98±0.030 | 99.0 | 1.52 |
| 1 D233 nm | 2 | 2.02±0.031 | 101.0 | 1.53 | 2.03±0.038 | 101.5 | 1.87 | |
| 1 D260 nm | 2 | 2.04±0.045 | 102.0 | 2.21 | 1.99±0.052 | 99.5 | 2.61 | |
| 1 D213 nm | 6 | 5.91±0.146 | 98.7 | 2.22 | 6.02±0.150 | 99.3 | 2.52 | |
| 1 D233 nm | 6 | 5.91±0.187 | 98.4 | 3.16 | 6.03±0.198 | 100.5 | 3.28 | |
| 1 D260 nm | 6 | 5.95±0.201 | 99.2 | 3.38 | 6.05±0.210 | 100.8 | 3.47 | |
| 1 D213 nm | 10 | 9.95±0.385 | 99.5 | 3.87 | 10.08±0.288 | 100.8 | 2.86 | |
| 1 D233 nm | 10 | 10.05±0.244 | 100.5 | 2.43 | 10.09±0.285 | 100.9 | 2.82 | |
| 1 D260 nm | 10 | 10.06±0.253 | 100.6 | 2.51 | 9.96±0.352 | 99.6 | 3.53 | |
|
Fortine (2 mg ml-1) |
1 D213 nm | 2 | 2.02±0.043 | 101.0 | 2.13 | 2.03±0.078 | 101.4 | 3.84 |
| 1 D233 nm | 2 | 1.99±0.022 | 99.5 | 1.11 | 1.98±0.086 | 99.0 | 4.34 | |
| 1 D260 nm | 2 | 2.04±0.035 | 102.0 | 1.72 | 2.04±0.092 | 102.0 | 4.51 | |
| 1 D213 nm | 6 | 5.98±0.153 | 99.7 | 2.56 | 5.98±0.175 | 99.7 | 2.93 | |
| 1 D233 nm | 6 | 5.96±0.268 | 99.3 | 4.49 | 6.05±0.169 | 100.8 | 2.79 | |
| 1 D260 nm | 6 | 5.96±0.164 | 99.3 | 2.75 | 5.97±0.195 | 99.5 | 3.27 | |
| 1 D213 nm | 10 | 10.22±0.198 | 102.2 | 1.94 | 9.85±0.252 | 98.5 | 2.56 | |
| 1 D233 nm | 10 | 10.12±0.285 | 101.2 | 2.82 | 10.18±0.162 | 101.8 | 1.59 | |
| 1 D260 nm | 10 | 9.98±0.268 | 99.8 | 2.69 | 10.09±0.296 | 100.9 | 2.93 | |
X: Mean, SD: Standard deviation of six replicate determinations, RSD: Relative standard derivation.
aAverage of six replicate determinations.
TABLE 4: STABILITY OF FLURBIPROFEN IN SOLUTION
| Method
|
Added
(mg ml-1) |
Room temperature stability 24 h | Room temperature stability 72 h | Refrigeratory stability,
+4°C 72 h |
Frozen stability,
-20 °C 72 h |
|
1 D233 nm |
5 | 102.9±0.064 | 98.76±3.216 | 100.1±1.020 | 98.70±0.264 |
| 10 | 98.09±4.507 | 100.8±2.034 | 99.30±0.094 | 98.57±0.214 | |
| 15 | 103.0±1.228 | 99.18±1.234 | 103.7±0.076 | 101.5±0.096 |
aRecovery % of of six replicate determinations
TABLE 5: THE RESULTS OF ANALYSES OF FLURBIPROFEN BY A DIFFERENT ANALYSTa
| Method | l (nm) | Added
(mg ml-1) |
Found (mg ml-1)
X±SD |
Recovery
(%) |
RSD
(%) |
| First-order Spectrophotometric Method |
1D233 nm |
5
10 15 |
4.89±0.138
10.14±0.421 15.18±0.541 |
98.4
101.7 100.9 |
2.96
2.89 1.91 |
l: Wavelength (nm), X: Mean, Mean measurements of six replicate determinations
Comparıson of the Methods: Flurbiprofen is a non-steroidal anti-inflammatory agent, one of the propionic acid groups, which has significant anti-inflammatory, analgesic, and antipyretic properties. In this study, a fast and simple first-order derivative spectrophotometric method is employed in the analysis of commercial preparations in the drug industry. The proposed method is used so much because it is a method easy to apply.
Also, Pharmacopoeias 21-23 have reported titrimetric and liquid chromatographic methods for the analysis of flurbiprofen in pure form and pharmaceutical formulations. Titrimetric method involves dissolving about 0.5 g of accurately weighed flurbiprofen in 100 mL of alcohol (previously neutralized with 0.1M sodium hydroxide versus to the phenolphthalein end point) and then, titrating the same (after adding phenolphthalein) with 0.1M sodium hydroxide versus till the first appearance of faint pink colour that persists for not less than 30 sec.
Each ml of 0.1 M sodium hydroxide is equivalent to 24.43 mg of flurbiprofen. Another method has recommended liquid chromatographic (HPLC) method for analysis of related substances in pure flurbiprofen and assay of flurbiprofen in pharmaceutical dosage form (tablet and ophthalmic drop). The methods recommended using a mobile phase of water-acetonitrile-glacial acetic acid (60:35:5, v/v) at a flow rate of 1 mL min-1, using UV detection (254 nm) on a stainless steel column (4 µm, 3.9×15 cm i.d.). A first-order derivative spectrophotometric method was applied for the determination of the commercial tablets Table 6.
The results show the high reliability and reproducibility of the method. Also, the suggested first-order derivative spectrophotometric method was compared with the official methods 21-23. There was no significant difference between the three methods concerning mean values and standard deviations at the 95% confidence level.
TABLE 6: DETERMINATION OF FLURBIPROFEN IN PHARMACEUTICAL PREPARATIONS
| Method | Commercial Preparation (100 mg) | l
(nm) |
n | Found (mg)
X±SD |
Recovery
(%) |
RSDa
(%) |
Confidence Interval | F- test |
| 1D233 nm | Majeski | 1D233 nm | 6 | 101.4±3.235 | 101.4 | 3.19 | 101.2-101.7 | 4.18a |
| Frolix | 1D233 nm | 6 | 100.9±2.896 | 100.9 | 2.87 | 99.9-101.6 | ||
| Maximus | 1D233 nm | 6 | 100.2±3.186 | 100.2 | 3.18 | 98.8-101.4 | ||
| Zero-P | 1D233 nm | 6 | 101.2±3.764 | 101.2 | 3.72 | 100.5-102.0 | ||
| Fortine | 1D233 nm | 6 | 99.8±2.36 | 99.8 | 2.36 | 98.4-101.7 |
SD: Standard deviation of six replicate determinations, RSD: Relative standard derivation, aAverage of six replicate determinations, Ho hypothesis: no statistically significant difference exists between five pharmaceutical preparations, Ho hypothesis is accepted (P > 0.05), aTheoretical values at P=0.05
CONCLUSION: In the present report, a simple, rapid, sensitive, reliable, specific, accurate and precise first-order derivative spectrophotometry method for the determination of flurbiprofen in pharmaceutical preparations was developed and validated. Flurbiprofen can be directly determined in tablets in the presence of excipients without sample pre-treatment procedures by using the first-order derivative spectrophotometric method. The apparatus and reagents used seem to be accessible even for the simple laboratories. Therefore, the developed method can be recommended for routine and quality control analysis of flurbiprofen.
ACKNOWLEDGEMENT: This study was supported by a Grant from Ataturk University Research Foundation (Project no: 2011/296).
CONFLICT OF INTEREST: Nil
REFERENCES:
- Townsend KP and Pratico D: Novel therapeutic opportunities for Alzheimer’s disease: focus on nonsteroidal anti-inflammatory drugs. The FASEB Journal 2005; 19: 1592-1601.
- Vega E, Egea MA, Garduno-Ramírez ML, García ML, Sánchez E, Espina M and Calpena AC: Flurbiprofen PLGA-PEG nanospheres: Role of hydroxy-β-cyclodextrin ex vivo human skin permeation and in vivo topical anti-inflammatory efficacy. Colloids and Surfaces B: Biointerfaces 2013; 110: 339-346.
- Tamborini L, Romano D, Pinto A, Bertolani A, Molinari F and Conti P: An efficient method for the lipase-catalyzed resolution and in-line purification of racemic flurbiprofen in a continuous-flow reactor. Journal of Molecular Catalysis B: Enzymatic 2012; 84: 78-82.
- Murali Mohan Babu GV, Prasad CDS, Hima Sankar K, Gouri Sankar V, Kishore Kumar N and Ramana Murthy KV: Development of new controlled release formulation of flurbiprofen: in vitro-in vivo correlation. Indian Journal of Pharmaceutical Sciences 2002; 64: 37-43.
- Kagkadis KA, Rekkas DM, Dallas PP and Choulis NH: A freeze-dried injectable form of flurbiprofen: development and optimization using response surface methodology. International Journal of Pharmaceutics 1998; 161: 87-94.
- Muraoka A, Tokumura T and Machida Y: Evaluation of the bioavailability of flurbiprofen and its β-cyclodextrin inclusion complex in four different doses upon oral administration to rats. The European Journal of Pharmaceutics and Biopharmaceutics 2004; 58: 667-671.
- Poul J, West J, Buchanan N and Grahame R: Local action transcutaneous flurbiprofen in the treatment of soft tissue rheumatism. British Journal of Pharmacology 1993; 32: 1000-1003.
- Guo CC, Tang YH, Hu HH, Yu LS, Jiang HD and Zeng S: Analysis of chiral non-steroidal anti-inflammatory drugs flurbiprofen, ketoprofen and etodolac binding with HSA. Journal of Pharmaceutical Analysis 2011; 1: 184-190.
- Askholt J and Nielsen-Kudsk F: Rapid HPLC-determination of ibuprofen and flurbiprofen in plasma for therapeutic drug control and pharmacokinetic applications. Acta Pharmacologica et Toxicologica 1986; 59: 382-386.
- Chi SC, Kim H and Lee SC: High Performance Liquid Chromatographic. Analysis of flurbiprofen in rat plasma. Analytical Letters 1994; 27: 377-389.
- Johnson VA and Wilson JT: Flurbiprofen analysis in plasma and breast milk by High-Performance Liquid Chromatography. Journal of Chromatography 1986; 382: 897-901.
- Adams WJ, Bothwell BE, Bothwell WM, VanGiessen GJ and Kaiser DG: Simultaneous determination of flurbiprofen and its major metabolite in physiological fluids using liquid chromatography with fluorescence detection. Analytical Chemistry 1987; 59: 1504-1509.
- Hutzler JM, Fyre RF and Tracy TS: Sensitive and specific high-performance liquid chromatographic assay for 49-hydroxy-flurbiprofen and flurbiprofen in human urine and plasma. Journal of Chromatography B 2000; 749: 119-125.
- Kang JH, Oh DH, Oh YK, Yong CS and Choi HG: Effects of solid carriers on the crystalline properties, dissolution and bioavailability of flurbiprofen in solid self-nano emulsifying drug delivery system (solid SNEDDS). European Journal of Pharmaceutics and Biopharmaceutics 2012: 80; 289-297.
- Pe’hourcq F, Jarry C and Bannwarth B: Chiral resolution of flurbiprofen and ketoprofen enantiomers by HPLC on a glycopeptide-type column chiral stationary phase. Biomedical Chromatography 2001; 15: 217-222.
- Geisslinger G. Menzel-Soglowek S, Schuster O and Brune K: Stereoselective High - Performance Liquid Chromato-graphic determination of flurbiprofen in human plasma. Journal of Chromatography 1992; 573: 163-167.
- Knadler MP and Hall SD: High-performance liquid chromatography analysis of the enantiomers of flurbiprofen and its metabolites in plasma and urine. Journal of Chromatography 1989; 494: 173-182.
- Hirai T, Matsumoto S and Kishi I: Simultaneous analysis of several non-steroidal anti-inflammatory drugs in human urine by High-Performance Liquid Chromatography with normal solid-phase extraction. Journal of Chromatography B 1997; 692: 375-388.
- Riegel M and Ellis PP: High- Performance Liquid Chromatographic assay for anti-inflammatory agent’s diclofenac and flurbiprofen in ocular fluids. Journal of Chromatography B 1994; 654: 140-145, 20.
- Mano N, Narui T, Nikaido A and Goto J: Separation and determination of diastereomeric flurbiprofen acyl glucuronides in human urine by LC/ESI-MS with a simple column-switching technique. Drug Metabolism and Pharmacokinetics 2002; 17: 142-149.
- United States Pharmacopoeia: United States Pharmacopoeial Convention, Rockville, MD, Edition 24th, 2000: 748-750.
- British Pharmacopoeia: British Pharmacopoeial Commission, London, 1993: 292-293.
- The Pharmacopoeia of India, Indian Pharmacopoeial Commission, New Delhi, 1996: 328-329.
- Ojeda CB and Rojas FS: Recent developments in derivative Ultraviolet / Visible absorption spectro-photometry. Analytica Chimica Acta 2004; 518: 1-24.
- The European Agency for the Evaluation of Medicinal Products. ICH Topic Q2B Note for Guideline on Validation of Analytical Procedures: Methodology GPMP/ICH/281/95, 1996.
How to cite this article:
Alkan E and Yilmaz B: Determination of flurbiprofen in pharmaceutical preparations by first-order derivative spectrophotometry method. Int J Pharmacognosy 2014; 1(2): 130-37. doi link: http://dx.doi.org/10.13040/IJPSR.0975-8232.IJP.1(2).130-37.
This Journal licensed under a Creative Commons Attribution-Non-commercial-Share Alike 3.0 Unported License.
Article Information
7
130-137
853
1512
English
IJP
E. Alkan and B. Yilmaz*
Department of Analytical Chemistry, Faculty of Pharmacy, Ataturk University, 25240, Erzurum, Turkey
yilmazb@atauni.edu.tr
20 September 2013
13 January 2014
26 January 2014
http://dx.doi.org/10.13040/IJPSR.0975-8232.1(2).130-37
01 February 2014